Power Mocks, Monitors, and CI/CD with Postman – Webinar Recap Part 3
We recently completed an online workshop series. In part 1, we went over how you can import a schema, save example responses, create descriptions, share your collection with others, create workspaces, comment on collections, and quickly create documentation. In part 2, we walked through using version control and forking and merging.
If you’ve been following along with part 1 and 2 of this recap, you should have the Swagger Petstore collection imported in Postman. If not, you can either import the schema, or you can follow along with a collection of your own.
In the third and final part of the workshop series recap, we’ll walk through how to use Postman features like mocking, monitoring, and how to get started with a CI/CD pipeline using Newman. Follow along with this step by step tutorial or watch the recording.
Creating a Mock Server
Mock servers are powered by response bodies. A response body is hosted on the cloud so it can be hit from anywhere, allowing you to see how your API will run before it’s pushed to production.
Mock servers are useful for collaboration, API design, and debugging. Postman users use mocks to decouple the development process so their team can work independently and in parallel, build a proof of concept for new ideas and products, communicate an API’s desired behavior for specific dependencies, and save time in setting up and maintaining servers.
Note: if you want to mock an existing collection, go to the ellipsis (…) icon in Postman, select Mock this Collection, and follow along from step 3.
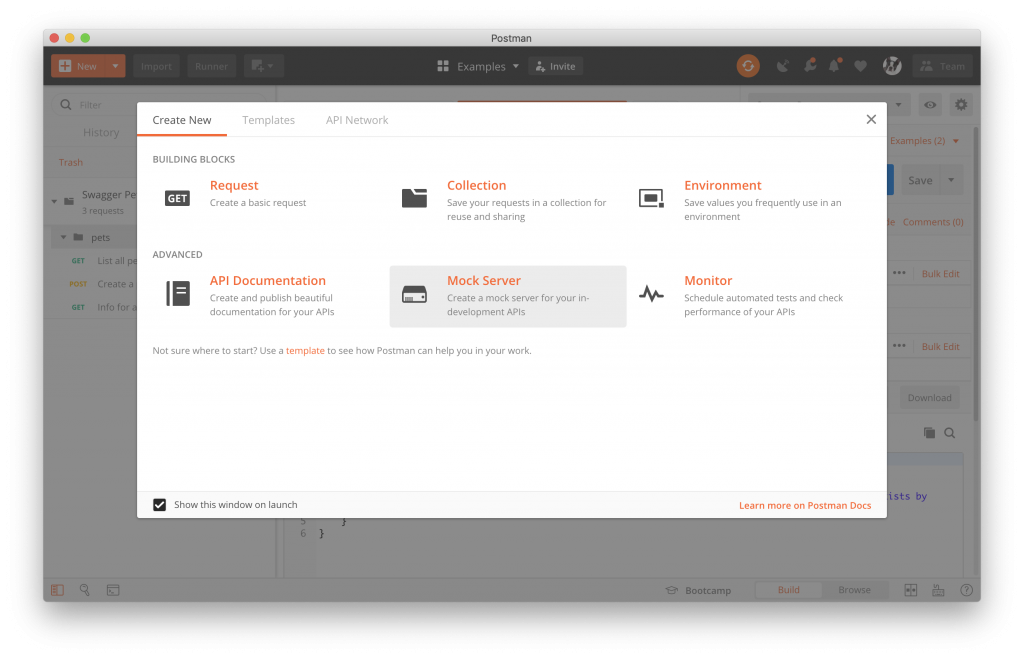
1) Click the New button and select Mock Server.
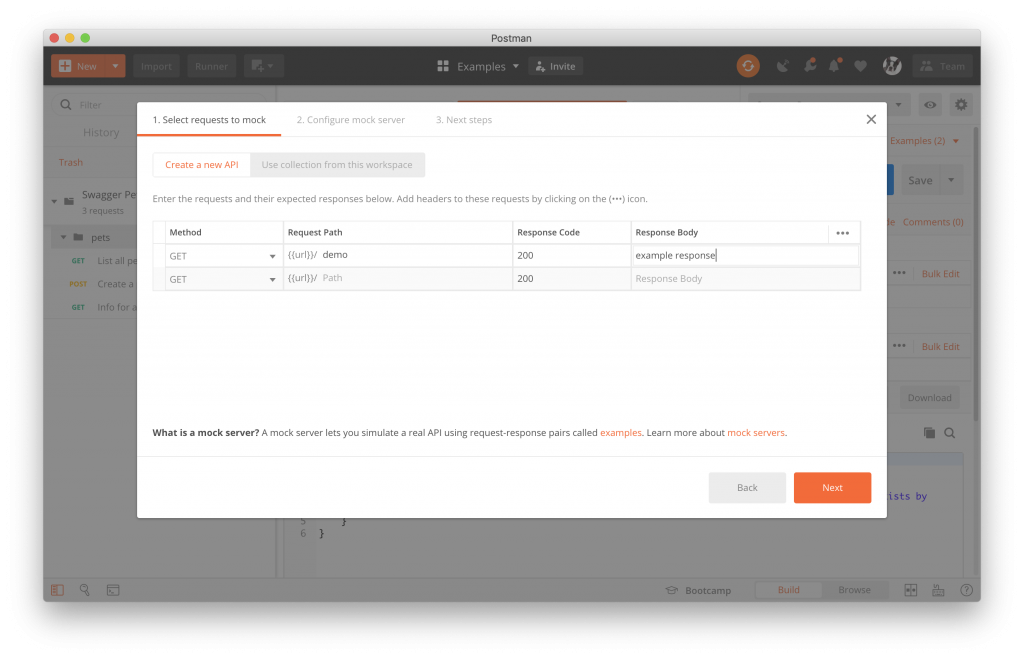
The next window will ask you to fill in some information about your new mock server.
2) Fill in the path and response body and click Next.
Every mock requires two things: a unique path and a response body. Fill in the path and response body.
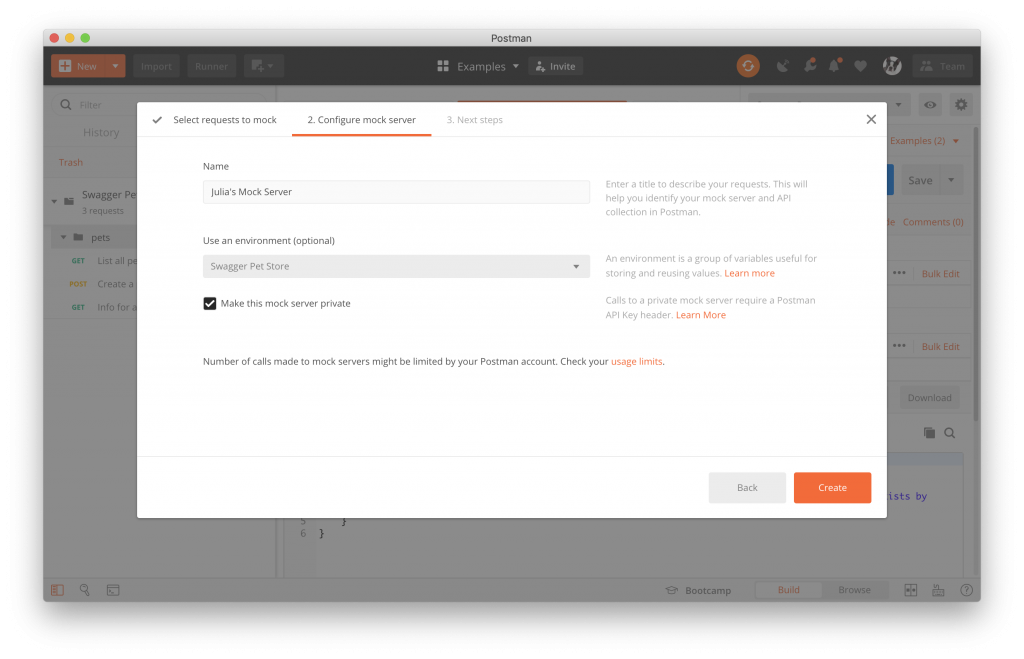
3) Name your new collection, choose an environment, choose privacy settings, and click Create.
Enter a name to describe your requests so you can easily identify your mock server and collection in Postman. Next, you can select the corresponding environment to go along with your collection.
Postman gives you the option to create a private mock. If you want to share your mock server with collaborators, you can create a public mock.
Note: You can have multiple mock servers per collection. You may want to do this if you are working with multiple teams or multiple people. A team or individual may only need access to a mock for a certain amount of time at which point you can revoke access.
4) Share your mock server to collaborate (or not).
Once the mock is created, you can share the mock with your team for review and collaboration. This is accomplished by sharing the associated collection with a team or specific team members, and adding permissions for them to edit or view the collection.
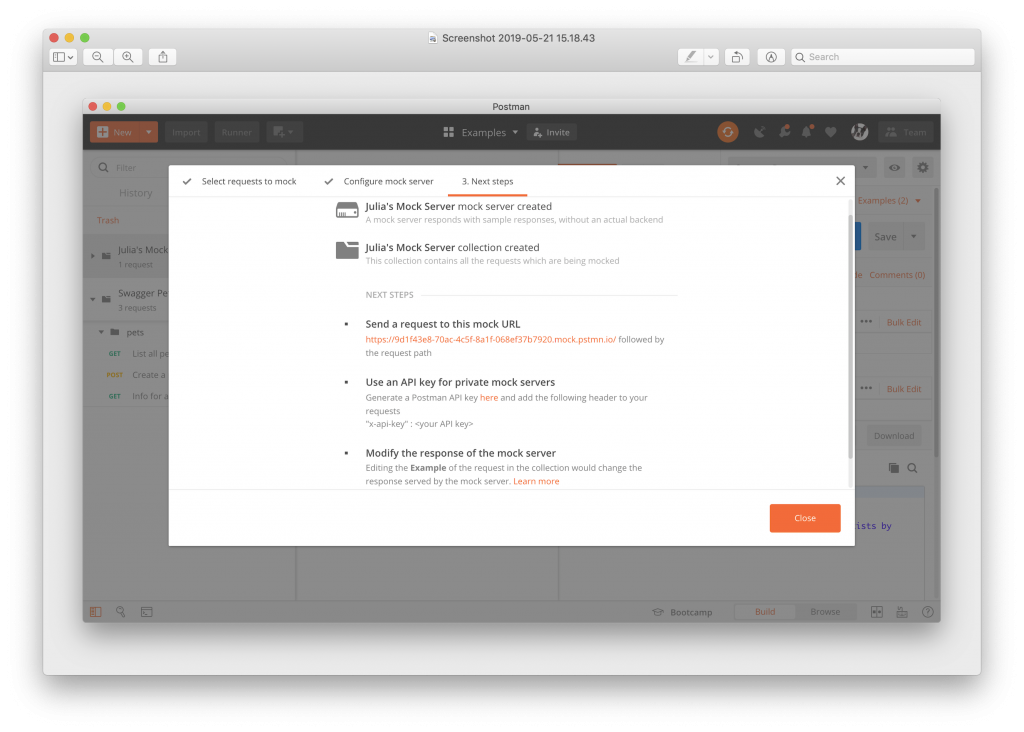
5) Test an endpoint with your mock server URL.
Once your mock server is created you will be given a URL that you and your team can use to test your endpoints. You can copy and pasted this URL to use it within Postman or in your browser.
6) In a request, change the base URL with the mock URL to test your endpoint.
To test an endpoint, replace your base URL with your mock URL followed by the path.
For example,
{{baseUrl}}/pets?limit=<integer>will become:
{{mockUrl}}/pets?limit=<integer>In your environment, the initial value is stored on the server and the current value is stored locally. If you only want to use your mock personally, you can just set the mock URL to the current value (then only you can use the mock).

If you want the rest of your team to be able to use the mock as well, you can set the URL as the initial value.
7) Send your request.
Once you finish setting up your mock server, you can use the mock URL to test any endpoint on your collection, so you can see exactly how your API will run.
Additionally, mock URLs work outside of Postman. Just paste the mock URL along with the endpoint into your browser and you’ll receive the same body that you get in Postman. This allows you to work externally on a project or hand off the mock URL to a team member without having to spin up the backend.
Creating a Monitor
Monitors signal Postman servers to hit endpoints in your collection according to the frequency you choose (you can run Postman monitors as frequently as every 5 minutes). This allows you to review API responses, availability, and performance with each run so you can ensure that your API is always healthy.
In addition to checking endpoints, you can run recurring tests to monitor more targeted aspects of your API, including poor performance, response errors, and outages. In this section, I’ll walk through how you can create a test suite and run it periodically using Postman monitors.
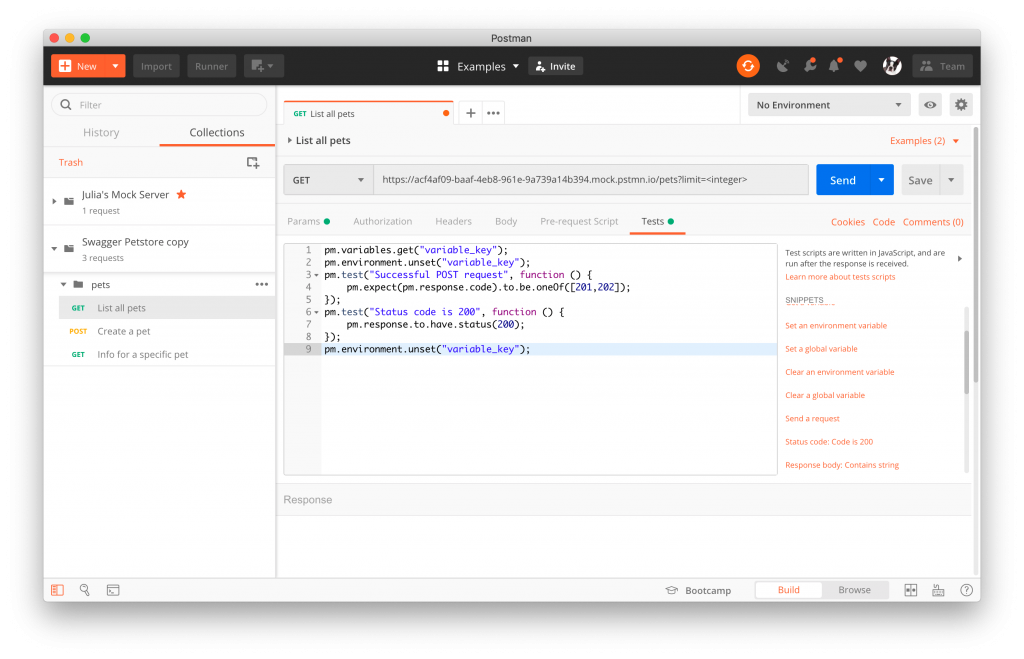
1) Select the “Get all pets” request and click on the Tests tab.
In the Tests tab, you’ll see a list of JavaScript test snippets:
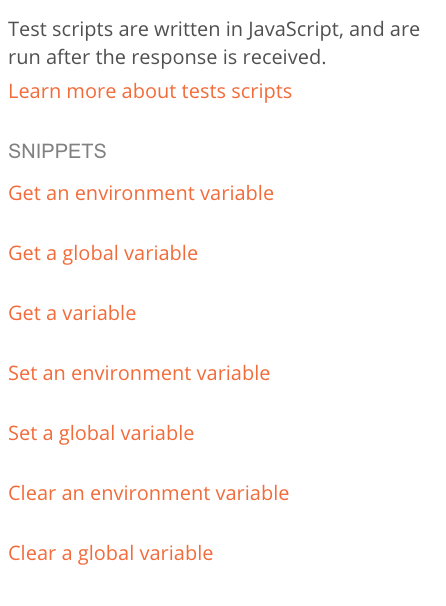
2) Choose test snippets or write tests.
You can run one or several tests on a schedule using monitors. You can use Postman’s test snippets, write your own tests, or both.
Your test results will appear in the monitoring report. Now that you have a test suite, you can set up your monitor.
3) Click the ellipsis (…) next to your collection and select Monitor Collection.
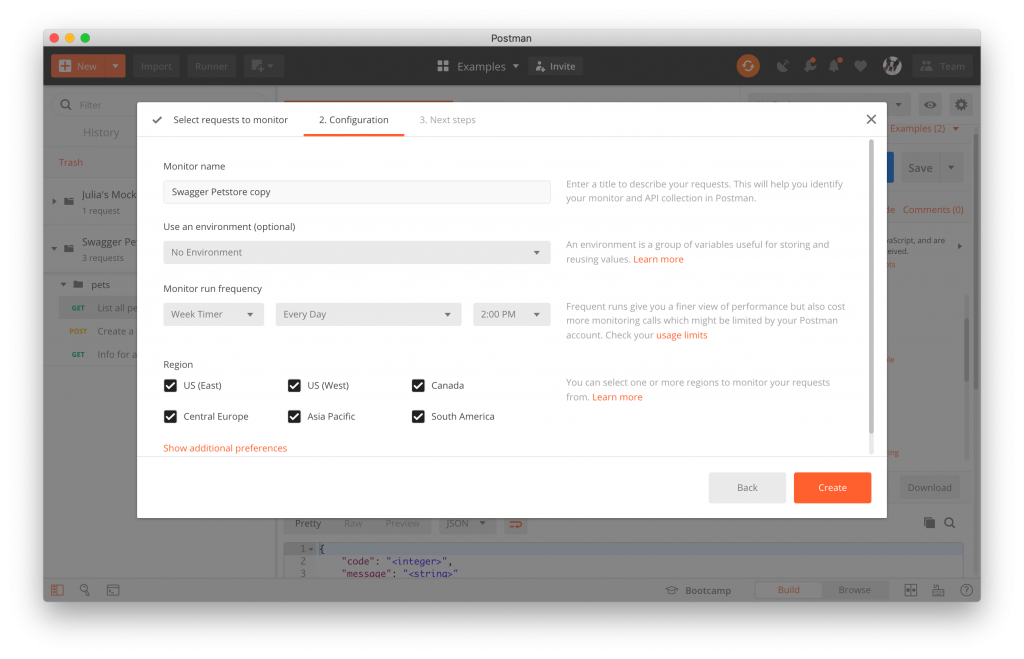
A window will open where you can enter a name for your monitor, and choose your environment, run frequency, and your preferred regions.
4) Customize your monitor and save.
Set your monitor to accommodate your preferences.
- Environment: Adding an environment enables you to monitor your variables to ensure that they remain valid and allows you to monitor any other functions that require authentication keys that may be stored in your environment.
- Run frequency: You can run monitors as frequently as every 5 minutes. The default for notifications is one email per monitor, but you can turn off email notifications if you prefer.
- Regions: Postman supports monitoring in 6 geographic regions around the world, so you can ensure your API remains resilient and globally available.
Viewing Monitoring Results
Postman’s detailed monitoring dashboard gives you a straightforward, visual overview of your monitoring results so you can quickly and easily identify problems.
1) Log into your account to view your dashboard.
2) Choose the appropriate workspace.
3) Select the Monitors tab.
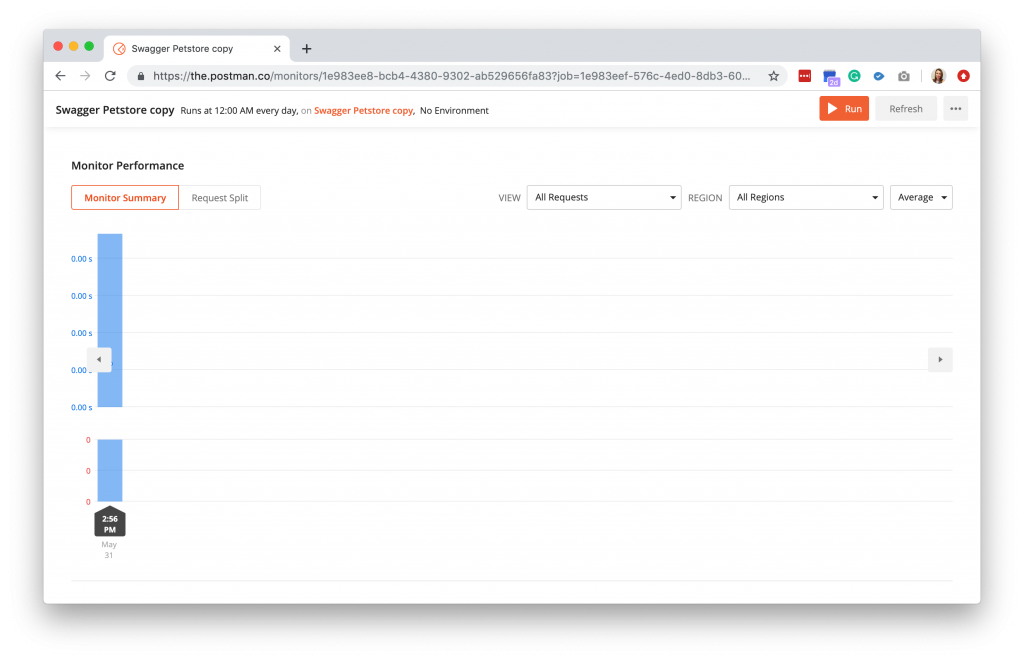
4) Select the Monitor you just created.
Your monitor summary allows you to see a monitoring summary from each monitor run by region.
Editing or Deleting Monitors
If you no longer need a monitor or need to make changes, you can do so through your dashboard.
1) Log into your account to view your dashboard.
2) Choose the appropriate workspace.
3) Select the Monitors tab.
4) To delete your monitor, click the trash icon to the right of your monitor.
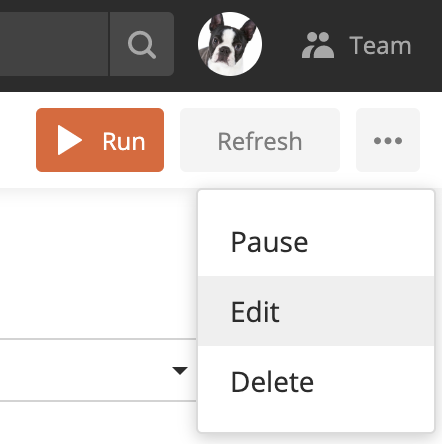
5) To edit your monitor, select the ellipsis (…) in the top right corner and select edit. You will be able to edit every aspect of your monitor.
Setting Up Notifications
Postman’s default is to send an email notification every time your monitor runs. To edit these options, follow the steps below.
1) In the Monitors tab on your dashboard, select the ellipsis (…) in the top right corner and select Edit.
2) Click on Show Additional Preferences toward the bottom of the page.
3) Edit your preferences and save.
You can either turn off notifications completely, change the email address, or add additional email addresses to receive notifications.
Note: If you need to send monitoring notifications to a team larger than five people, you can set up an email alias and Postman will notify everyone connected to the alias.
Getting Started with a CI/CD Pipeline using Newman, Travis CI, and GitHub
Continuous integration and continuous deployment (CI/CD) allows you to regularly merge updates into a shared repository through an automated process. Usually, a CI/CD pipeline will be triggered at each new build and will merge updates only after going through a slew of tests that ensure that the changes won’t break anything.
Newman is Postman’s command line tool. It allows you to access Postman’s features from the command line and easily integrates with your existing continuous integration systems like Travis CI, Jenkins, or AppVeyor.
In this example, we’ll walk through setting up Newman with GitHub and Travis CI. This section will only walk you through the initial setup. For more extensive resources on CI/CD, read the docs.
Pre-requisites
- You’ll need a GitHub repository. If you don’t have one, you can create one here.
- You need to set up Travis CI. It’s easy and takes just a few minutes. The Travis CI getting started guide will walk you through all the details.
If you already have Newman installed, skip to step 3.
1) Install Node.
If you don’t already have Node installed, you can download it here. Follow the OS-specific instructions in order to download it via terminal.
2) Install Newman via terminal.
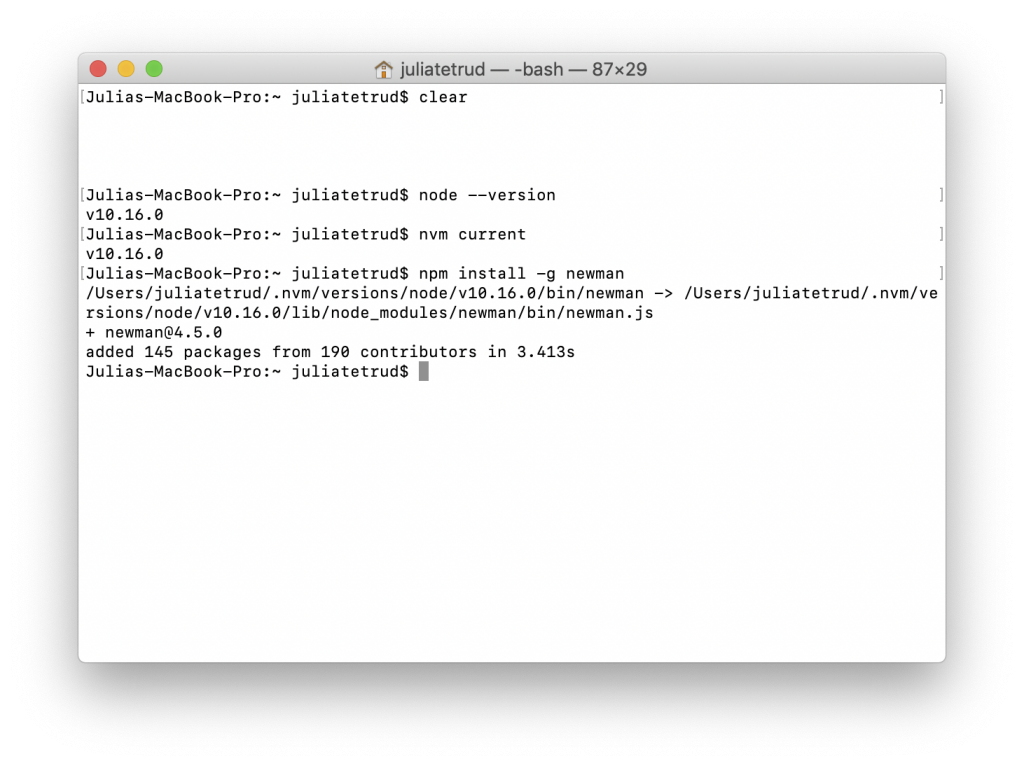
Once you have successfully installed Node, type the following command into your terminal.
npm i newman -g;Press enter, and your package should begin to install. The result should look something like this:
3) Sign into Travis CI with GitHub and enable Travis CI.
When you sign into Travis CI with GitHub, you will need to authorize Travis CI. It takes just a minute and then you’ll be directed to your Travis CI profile page.
4) Activate your repository via your Travis CI profile.
On your Travis CI profile, press the + icon in the left-hand menu:
Then, next to your repository, click settings.
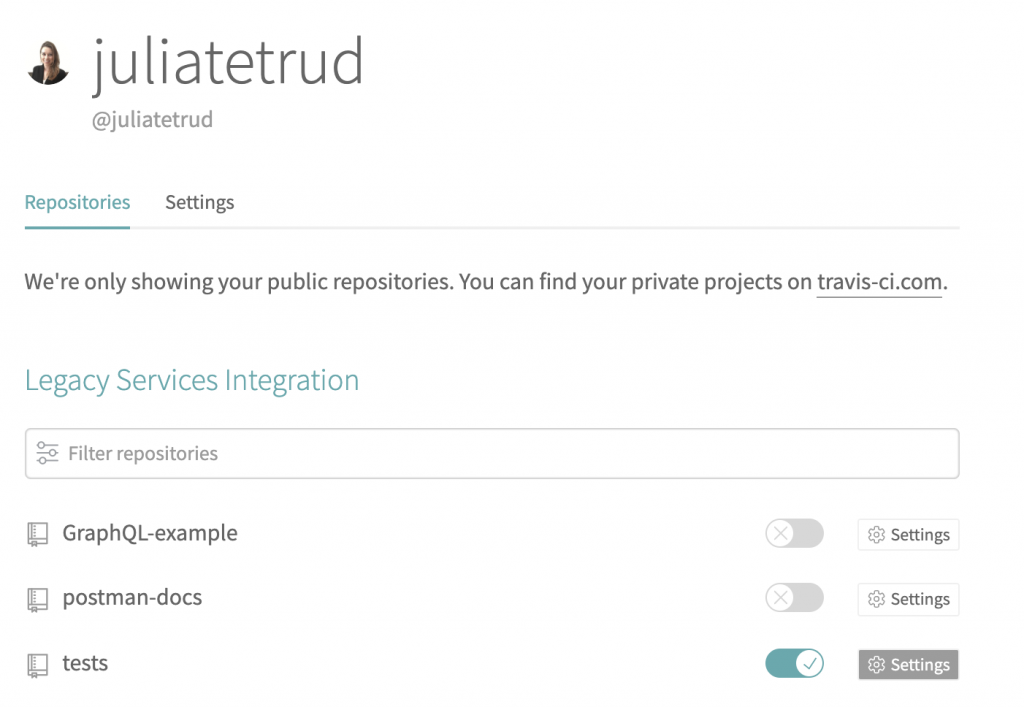
Click on Activate repository.
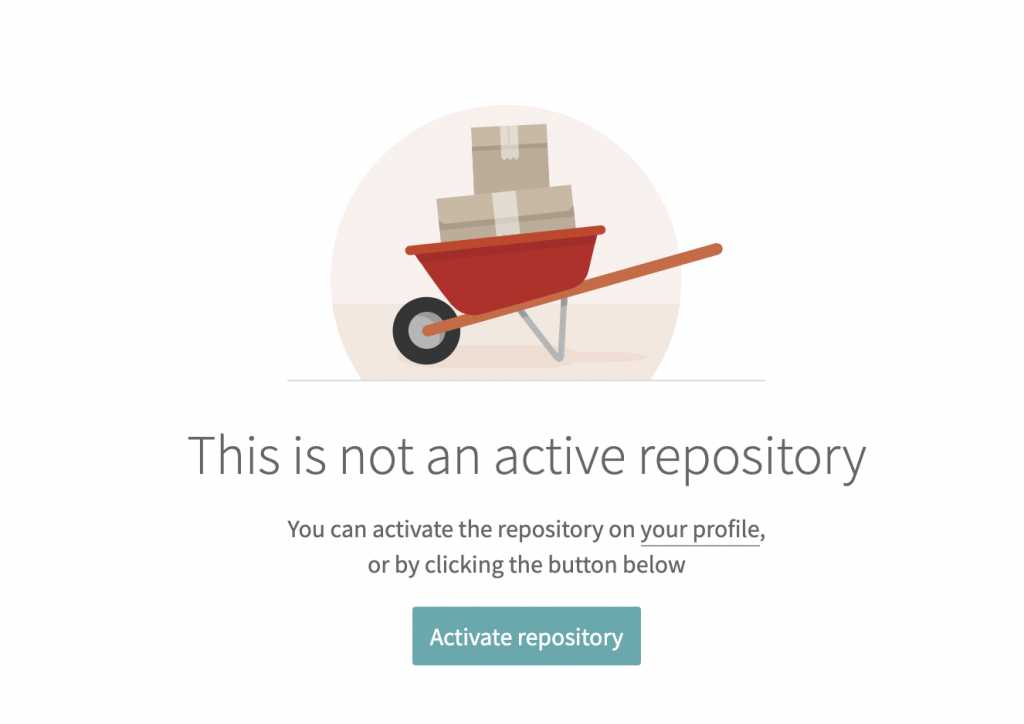
Now that your repository is activated, your Newman, your GitHub repository, and Travis CI should be in sync and able to communicate.
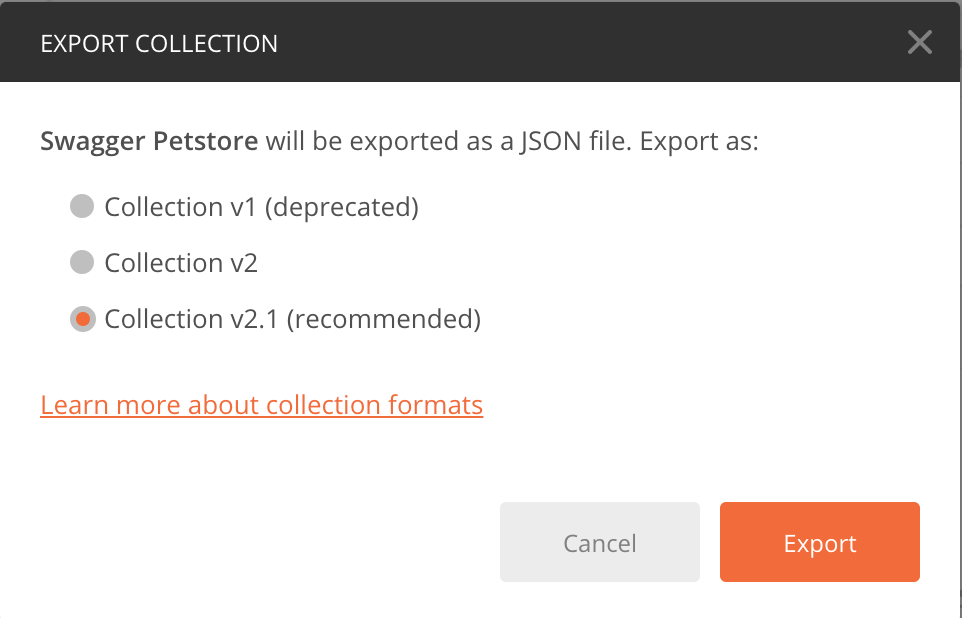
5) Click the ellipsis (…) next to your collection and select Export.
Export your Swagger Petstore as a JSON file and save it. You’ll need to access your collection via Newman later.
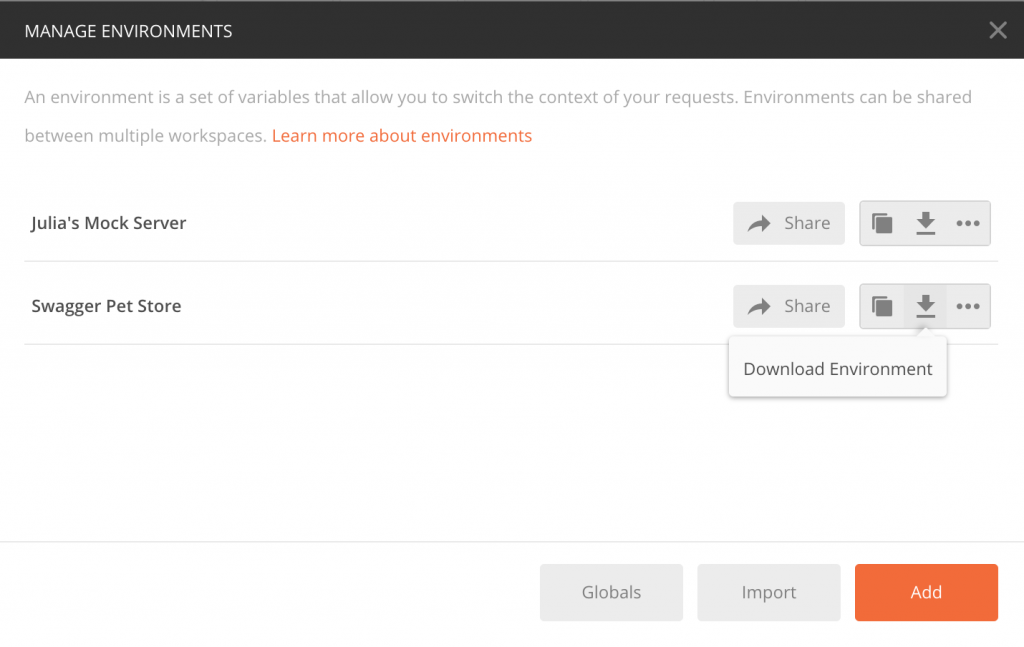
6) Click on the Manage Environments (the gear icon) and download your environment.
Save your environment along with your collection.
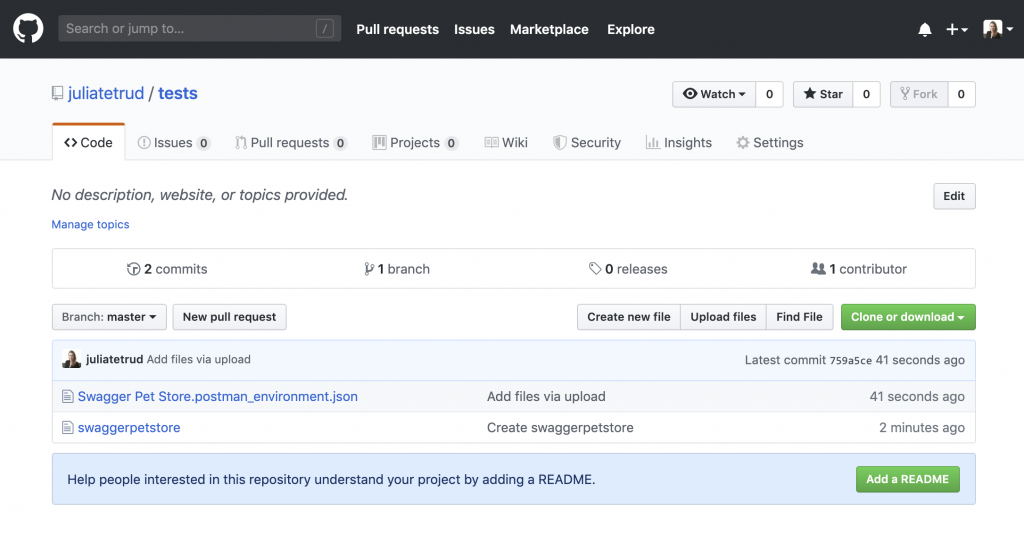
7) Commit your collection and environment files to your repository.
For this example, I created a new repo and added my collection and environment JSON files.
You can create new files in your repository under the <>Code tab.
8) Create a new file.
This file will communicate the programming language and build instructions for your project to Travis CI.
Name your file: .travis.yml
In order to add these instructions, you’ll need to write a few commands.
In your file body, you’ll need to indicate the language you’re using (in this case, Node.js) and which version of Node.js you have installed.
In this example, I am using v10.16.0, but you’ll need to update your code with the version you have installed.
 language: node_js
node_js:
  - "10.16.0"
Next, you’ll need to tell Travis CI to install Newman.
install:
  - npm install newman
Then, in order to run the tests you’ve added to your collection, add a script that tells Newman to run your tests.
before_script:
  - node --version
  - npm --version
  - node_modules/.bin/newman --version
Last, update the path so Travis CI can find your files.
Make sure to replace the file names with the names you saved your collection and environment with. Replace postman_collection.json and postman_environment.json with your file names.
Note: I did not store my files in a separate folder. To include a folder location, preface the filename with a “/[folder_name]/” to indicate the proper location.
script:
  - node_modules/.bin/newman run petstore.postman_collection.json -e petstore.postman_environment.json
Once you enter those commands, your file body should look something like this:
language: node_js
node_js:
  - "10.16.0"

install:
  - npm install newman

before_script:
  - node --version
  - npm --version
  - node_modules/.bin/newman --version

script:
  - node_modules/.bin/newman run petstore.postman_collection.json -e petstore.postman_environment.json
9) Commit these changes to your repo.
Travis CI should now be set up and ready to run! Your Postman tests will run every time you push a commit to your repository.
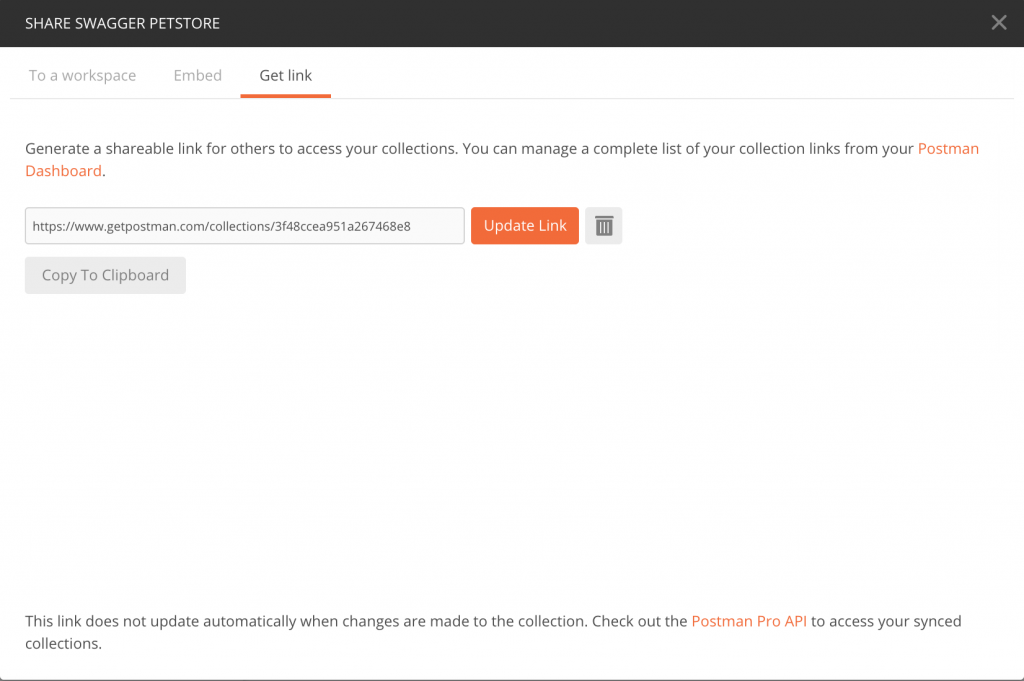
10) Open your Postman app and copy the link to your collection.
- To get the link for your collection, click on the ellipsis (…) next to your collection and select Share.
- Go to the “Get Link” tab.
- Copy your collection URL.
11) Open your terminal and tell Newman to run your collection.
Type the command and paste in your collection URL.
newman run [collection url] Hit enter.
The terminal will print your requests along with some other information on your collection.
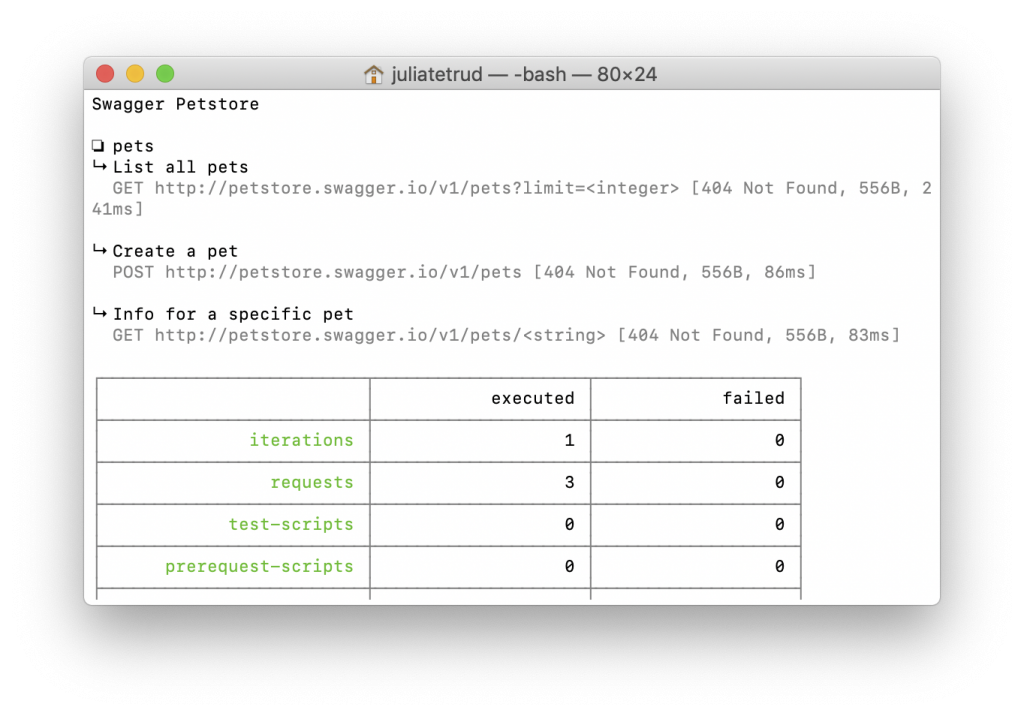
Now that Newman, Travis CI, and GitHub are set up, you can start pushing changes to your repo via Newman. Each time you push a change, the tests in your collection should run automatically. If your tests pass, you’ll see a new build in your GitHub repository. If your tests don’t pass, a report will identify any errors, so you can fix them before the changes are pushed to GitHub.
For more detailed resources to walk you through the next steps, check out some of our engineering blogs on testing or read our docs.
Bonus: To get even more out of Newman, check out Danny Dainton’s Newman reporter.


Hi , Can I i use any other ci/cd mechanism like gitlab with git hooks.