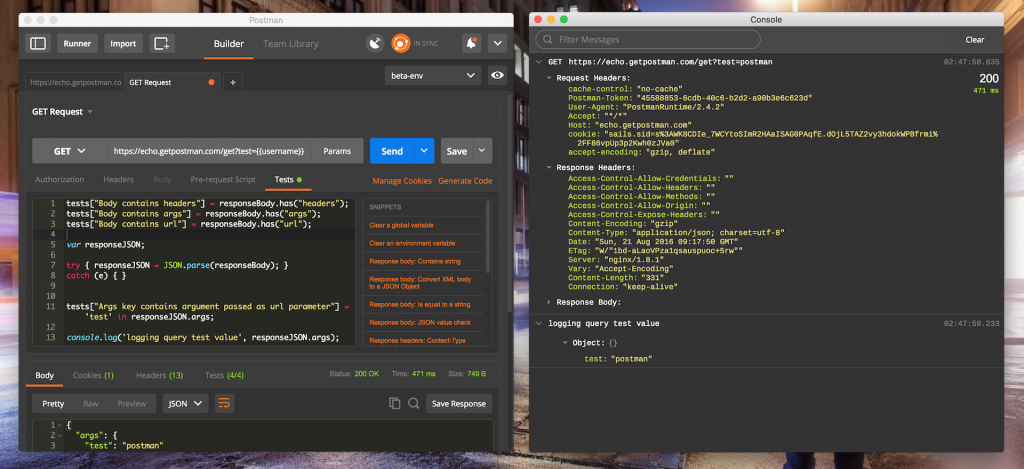
The Postman Console
If this topic interests you, check our recent blog posts with updates about the new Postman Console pane and powerful debugging.
With the release of Postman v4.5 for Mac, we introduced a new feature called the Postman Console. This new feature is so exciting that Vignesh (the one who started working on it) literally renamed himself to “console”!
One of the scariest things that we had to do (and recommend others to do as well) was to open up the underlying Chrome DevTools for simple things as inspecting your requests. The console (albeit extremely powerful) was an overwhelming source of information to find the simplest and obvious things associated with daily use of Postman. Hence, we built one that is easier to use.
Here’s the summary of what the new Console in Postman is all about:
- Postman Console is analogous to a browser’s version of the developer console, except that it’s tuned for API development.
- If an API or API test is not behaving as you expect, this would be the place where you will go to deep dive while debugging the same.
The keyboard shortcut to fire up the console is cmd + alt + c (ctrl + alt + c on Windows). As long as the console window is open, all your API activities will be logged here for you to see what’s going on under the hood. I usually keep it open all the time. It simply looks “geeky” that way!
Ok, what else?
The most useful information, for me personally, is that every request is logged in the console in its raw form, replacing all the variables that I have used in a request. This saves me a lot of time while debugging the request that was sent.
Another notable feature is the ability to inspect the entire list of headers that was sent when I request using Postman. Beyond the request headers one provides, Postman automatically sends additional useful headers that your server needs, and it is beneficial to know about them. At times, knowing exactly what these headers looked like helps me debug server issues faster than if I had used any other tool.
Currently Console also logs the following information:
- The actual request that was sent, including all underlying request headers, etc.
- The exact response sent by the server before it is processed by Postman
- What proxy and certificates were used during making the request.
- Error logs from test or pre-request scripts
console.logfrom inside scripts.
The last item (console.log output) is the another compelling reason why I keep going back to Postman Console. The backstory on this is very simple – I have test scripts in Postman Collections that do some really complicated stuff. And when I manage to mess them up, debugging it becomes even more complicated. But not any more, as I can now put console.info or console.warn at appropriate locations in my scripts and extract the exact line of code that is acting up. More details on how I do it is a discussion for the future. If you know your way around console.log in Javascript, this is exactly the same.
Why?
The internal JavaScript console of electron (using which Postman is built with) is available for use, then why make a separate console?
Three reasons:
- The original console is usually a place where Postman logs its internal debugging entries. That gets mixed with console logs from user scripts, making it difficult to distinguish between the two. Similar story for network calls.
- We recently moved to NodeJS driven runtime. Network calls from NodeJS does not show up inside Electron’s console. We needed an alternative.
- Postman Console is specially designed to aid debugging Postman collections and API calls. Network calls are now designed to be part of standard logs. With our own console, we can design it exactly the way you want it to be.
Try it out and let us know what more would be useful additions to the console?
PS: The recently released Newman v3 (Postman CLI) also has a special way to log console information from scripts in your terminal. So, the script logs that you put in Postman will, likewise, be visible when running the same collection in Newman.


Thanks! I was literally about to email you guys about using the console in the Windows client.
Hi ,
I am not able to open the console window in postman……..
Can You Please help me for the same……
I’m also unable to open the console in Win 7.
This is because you use Postman Chrome extension. And you should use Postman for Windows. Download it here https://www.postman.com/downloads/.
I had the same issue.) Hope it will help you.
One thing that would be useful, that doesn’t seem to happen at the moment, is to log to the console all the requests from the Authorization calls. I occasionally run into problems with my Auth code and I can never get any errors when testing in Postman.
That’s exactly what we are planning! Are we telepathic?! Once it’s ready, would love to get your feedback.
Useful Thank you 🙂
Great feature, keep them coming. Thanks
Hi ,
I am not able to open the console window in postman……..
Can You Please help me for the same……
Same – Win10 – can’t seem to get the ctrl+alt+c to pop open the console window. Is there an alternative way to open it?
Wow really nice feature this console. Gives a lot of nice insight. Really curious how you work with the info and warn features of Console.
Great feature but is there any way to dump the output of the console to a text file or similar to keep as an audit trail of testing that has been done?
Is there a way to clear the console at the start of a test script? I tried console.clear(); and console.clear; and clear(); but that didn’t work.
Have you ever thought about including a little bit more than just your articles?
I mean, what you say is fundamental and everything.
But think about if you added some great images or videos to give your posts more, “pop”!
Your content is excellent but with images and clips,
this blog could certainly be one of the very best in its field.
Fantastic blog!
Glad to hear you enjoyed the post 🙂
Real instructive andd excellent complex ody part off content,
now that’s user friendly (:.
Is there a way to open the console in the Linux native app? It has no menu and the mentioned shortcut doesn’t work.
I am using windows app -> Postman v5.1.2. Very recently I started noticing that when I click View > Show Postman Console, the “Console” windows sits on the task-bar of my windows machine and it never launches (or shows up). It used to work fine a couple of weeks back. Not sure if the recent update broke something for me?
Please ignore the previous question. It was an issue with my multi-monitor and windows re-sizing issue. Clicking the console window on the task bar and alt+space gives a context menu to move, resize, restore etc, and using that option, it started showing up correctly.
Hi,
in one the last versions of Postman (I’m running 7.12.0 now) the Postman Console becomes quite harder to use.
I used to open the console, fire some API calls, expand them in the console, then copy them to a text file to send or store them for future use.
Now the “raw” view has been substituted by the “pretty” view that does not permit a straight copy and paste of all the request’s data. Moreover, it seems not possibile to open as “raw view” more than a response at the same time.
Is there a way to replicate the former output of the Postman Console?
Thanks in advance.
so powerful function, It brings to me hapiness development