
New Postman Console Pane Makes It Easier to Debug and Troubleshoot
During the last four years, the Postman Console has been where developers immediately go when an API is behaving unexpectedly. There, they can dive deeper into the details of each request and response, and investigate the errors returned. The Postman Console is analogous to the developer console available in Firefox or Chrome, but it is much more fine-tuned to powerfully debug and troubleshoot APIs. And it’s yet another way we’re trying to provide transparency so that developers can better see (and work with) what is happening during API development. Still, we saw room for improvement—and so we recently released a new way to access the console.
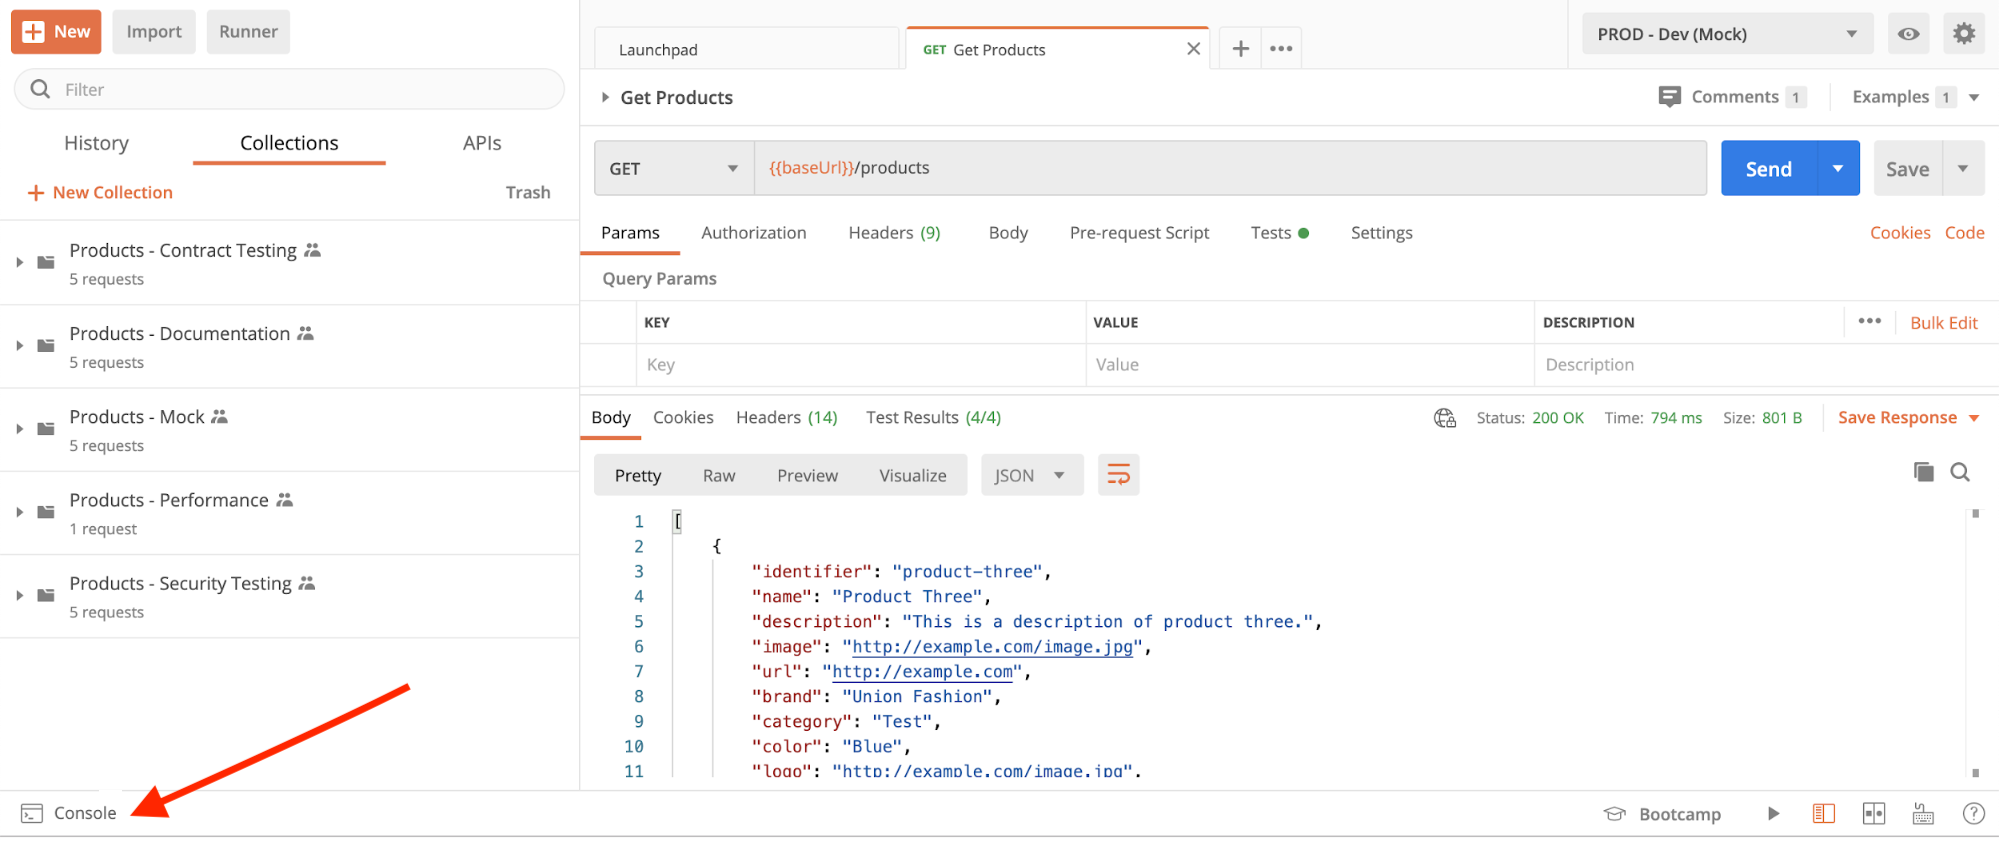
The Postman Console has historically been available through a link in the footer of the application or via a keyboard shortcut that loads the console as a separate window displaying all the debugging and troubleshooting information:
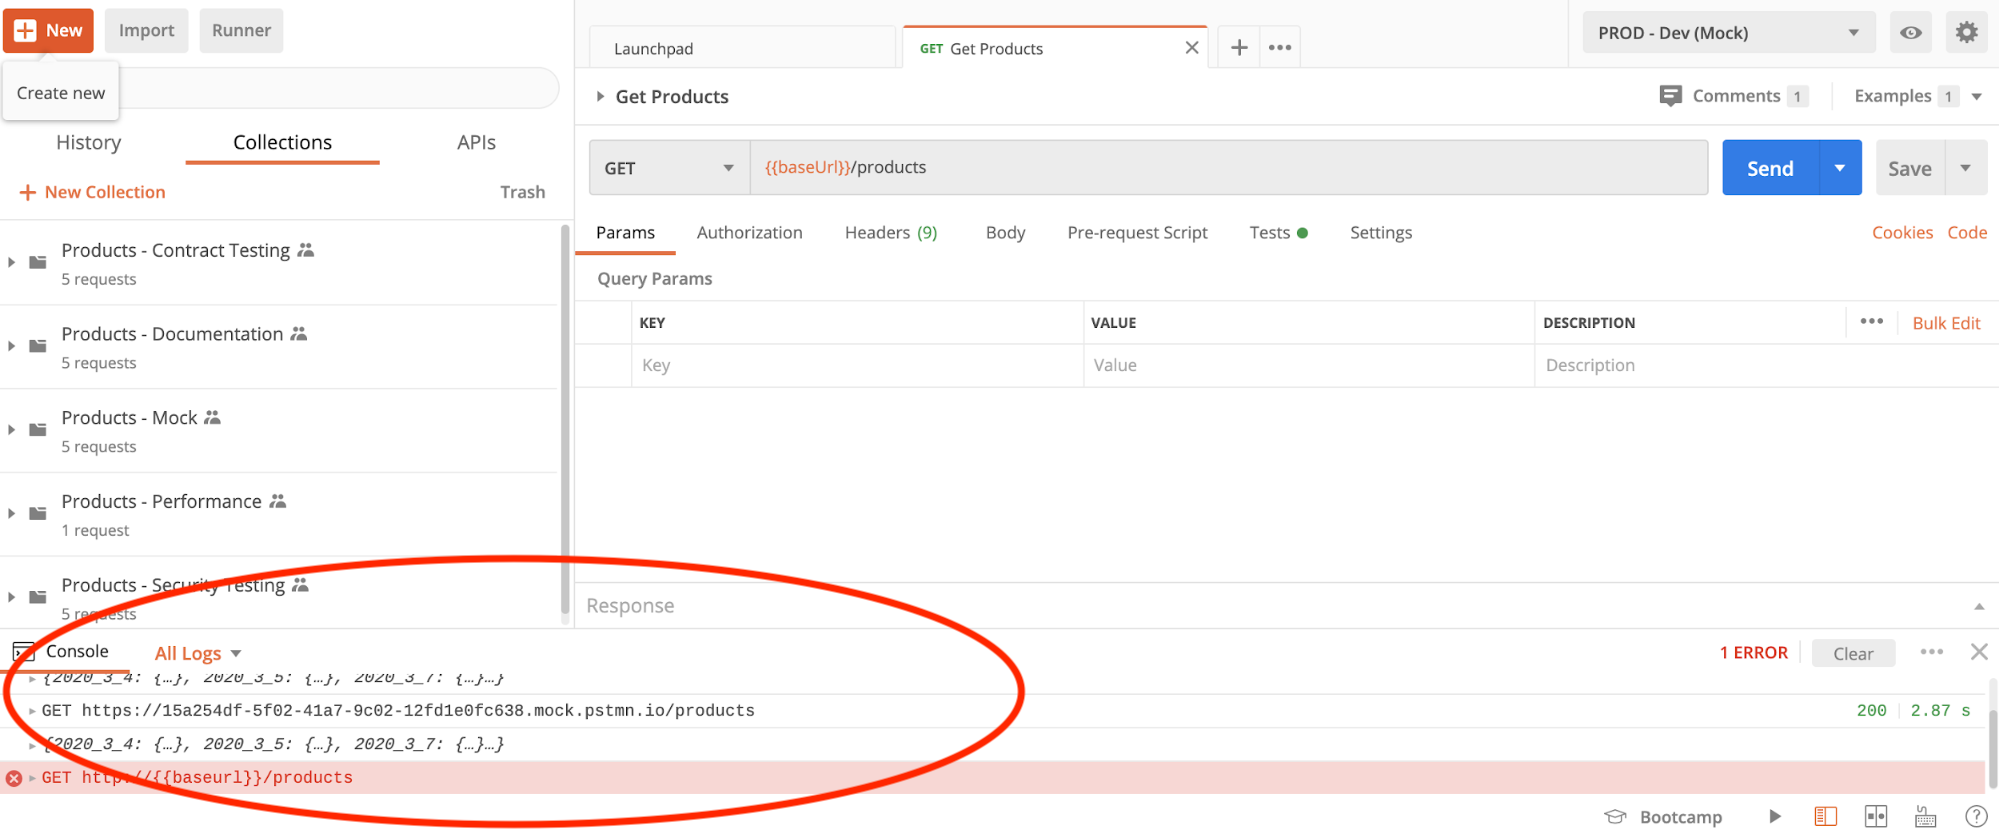
However, with the release of Postman v7.28, the Postman Console is now available as a new pane within the same window you’re working in, behaving more like developers would expect. This has made it much quicker and easier to view the debugging results for each API request made. The built-in pane provides rich details on warnings, errors, logs, and other info to help developers immediately see the full details of successful and unsuccessful responses without having to leave the screen:
When you’re frequently developing APIs in Postman, the time it takes to switch between the application and the console begins to really add up. By putting the console directly within the main application window and making it available in a single click, we’ve worked to save developers a lot of time.
The new placement of the Postman Console is available in both Postman for the desktop and Postman for the web, helping developers more efficiently debug and troubleshoot what is happening with the APIs they are working with each day.
The power of this console is limited only by your imagination, and also the last 5,000 messages and 24 hours.
Watch and learn
Level up your Postman game with our short YouTube video that explains how to use the Postman console for more visibility while debugging in one minute:


Sounds cool.
Commenting this blog doesn’t seem to be popular, so I decided to drop a note 🙂
Keep up the good work!
Thanks! Yeah, people don’t seem as into commenting as they once were. Social media seems to have sucked the oxygen out of the room. Thanks for chiming in!
Hi.
I have a questions.
How I can donwload complete the text of console log to file-text?
Because with Copy & Paste just I can only download a part of this.
Is there a way to still have it in a separate window as I really preferred it that way as on my laptop it’s all now just a cluttered squeeze of windows now which makes it painful to use.