Monitor APIs with Postman and New Relic
For DevOps specialists, having a consolidated view of IT infrastructure is crucial. At the time of an incident, these specialists must be able to correlate metrics from various sources to get to the root of the problem. With Postman’s just-released New Relic integration, you can now configure Postman monitors to send metrics to New Relic to help solve problems and resolve incidents more quickly. This new integration will help you get a consolidated view of your API metrics and any existing infrastructure metrics—including CPU usage, memory consumption, and database query patterns—directly in New Relic.
Sending metrics from Postman monitors to New Relic
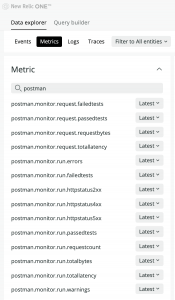
- Metrics in the image above are sent to New Relic and accessed from the Data Explorer in New Relic.
- Postman sends both run-level and request-level metrics. Run-level metrics comprise metrics valid for the entire run—the number of errors, for example—while request-level metrics will send you the data for each request within the collection. Here are further details about some of the metrics that are pushed from Postman to New Relic:
- postman.monitor.run.failedtests will give you the number of failed tests across all requests written in the Postman test script.
- postman.monitor.run.totallatency will give you the total latency after executing all the requests in the collection.
- postman.monitor.run.errors will give you the total number of errors—such as DNS resolution errors—that occurred while executing the requests.
- postman.monitor.run.totalbytes will give you total bytes exchanged while running the monitor.
- postman.monitor.run.2XX, 4XX, 5XX will give you the total count of these status codes of your APIs.
- postman.monitor.request.failedtests and postman.monitor.request.totallatency will give you metrics at the request level. You can filter to each specific request using the dimensions passed along with the metric as shown below.
Pivot your data across dimensions
Postman allows you to monitor your API across regions, which is helpful for APIs that are consumed in different global geographies. In New Relic, you can then pivot the data received with the “region” dimension which will give you a clear picture of the latency of your service across regions, as seen here:
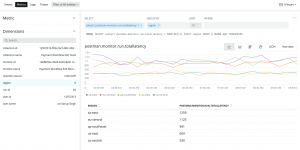
Latency data pivoted with the “region” dimension
Postman also sends other attributes that you can use to slice and dice the data. These include the names and identifiers for your monitor, collection, and request. Here’s an example:
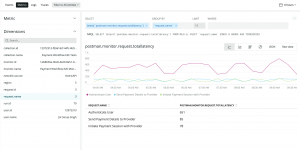
Latency data pivoted with the “request name” dimension
External API monitoring
By comparing your API’s performance (e.g., latency metrics) and functionality (e.g., response correctness) with your IT infrastructure metrics such as CPU load, RAM usage, and network stats, you can more quickly and precisely discover the cause of issues in your API.
Related: What is API Monitoring?
Several factors could cause degradation of your API, and usable dashboards are the first requirement to debug rapidly.
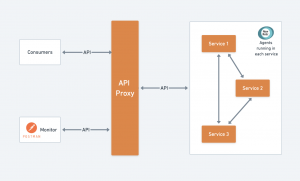
A sample architecture with New Relic collecting metrics from the microservices and Postman monitors testing user-facing API latency and responses
Externally monitoring your API for latency is key to getting the most accurate depiction of API performance, because any monitoring agent that sits on your server will not be able to consider factors that an actual client will experience, like DNS resolution, SSL handshakes, and caching.
Modeling and monitoring end-to-end transactions
Consider complex tasks or workflows where multiple API calls are aggregated into a view for the user. These can be easily modeled inside Postman, where you can use variables and environments to manage data in each API call. You can reference variables across requests, collections, and environments to effectively create workflows.
Here’s an example: A payment transaction can involve multiple steps from the client involving passing data from one request to another. Specifically, the payment transaction might involve creating a session ID and using it in subsequent calls. A simplified flow diagram is seen here:
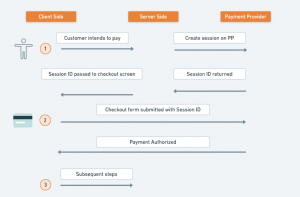
Workflow demonstrating steps involved in completing a payment
With Postman, you can re-create the flow in a collection with requests and variables and then set up a monitor to track the latency for the complete, end-to-end transaction (see sample below). You can even add time delays between requests to mock actual user behavior.
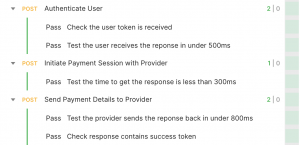
A sample showing test cases covering user response latencies and data validation across the whole end-to-end flow
Alerting in New Relic
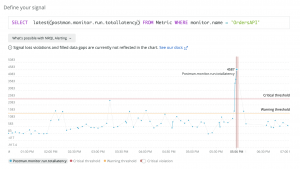
The new Postman-New Relic integration is also useful if you want to capitalize on the various intelligent alerting capabilities that New Relic provides, such as self-adjusting thresholds, anomaly detection, and outlier detection. You can define static warnings and critical thresholds, and any breach on your defined metrics would create an alert in New Relic. You want to define more flexible “baseline” thresholds that dynamically adjust to how your data behaves.
Static threshold
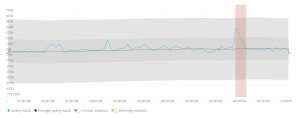
Baseline threshold
Dashboards in New Relic
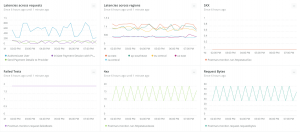
You can easily create a dashboard to effectively view all of the Postman monitor data in a single view. Metrics can be shown on the dashboard using the UI or using New Relic Query Langauge (NRQL).
To get started, visit the New Relic integration page in the Postman Learning Center.

What do you think about this topic? Tell us in a comment below. You can also give product feedback through our Community forum and GitHub repository.