
Integrated API Monitoring in Postman
Continuous monitoring is essential for the success of an API. That’s why companies today are investing heavily in the proper tools to monitor and observe the performance of their APIs. According to Apigee’s State of API Economy 2021 report, 20% of the companies surveyed indicated that growing investment in API operations and monitoring was the top goal of their year. With multiple tools at play, it is becoming increasingly difficult to track the performance across tools.
With the latest release, Postman allows you to extend your API monitoring workflows by letting you connect to various analytics, incident management, and internal messaging tools. You can now view critical information in one dashboard: see data about recent runs, channels for notifications, and linked services—all without having to move between different tools.
Monitor your API and connect it to your stack
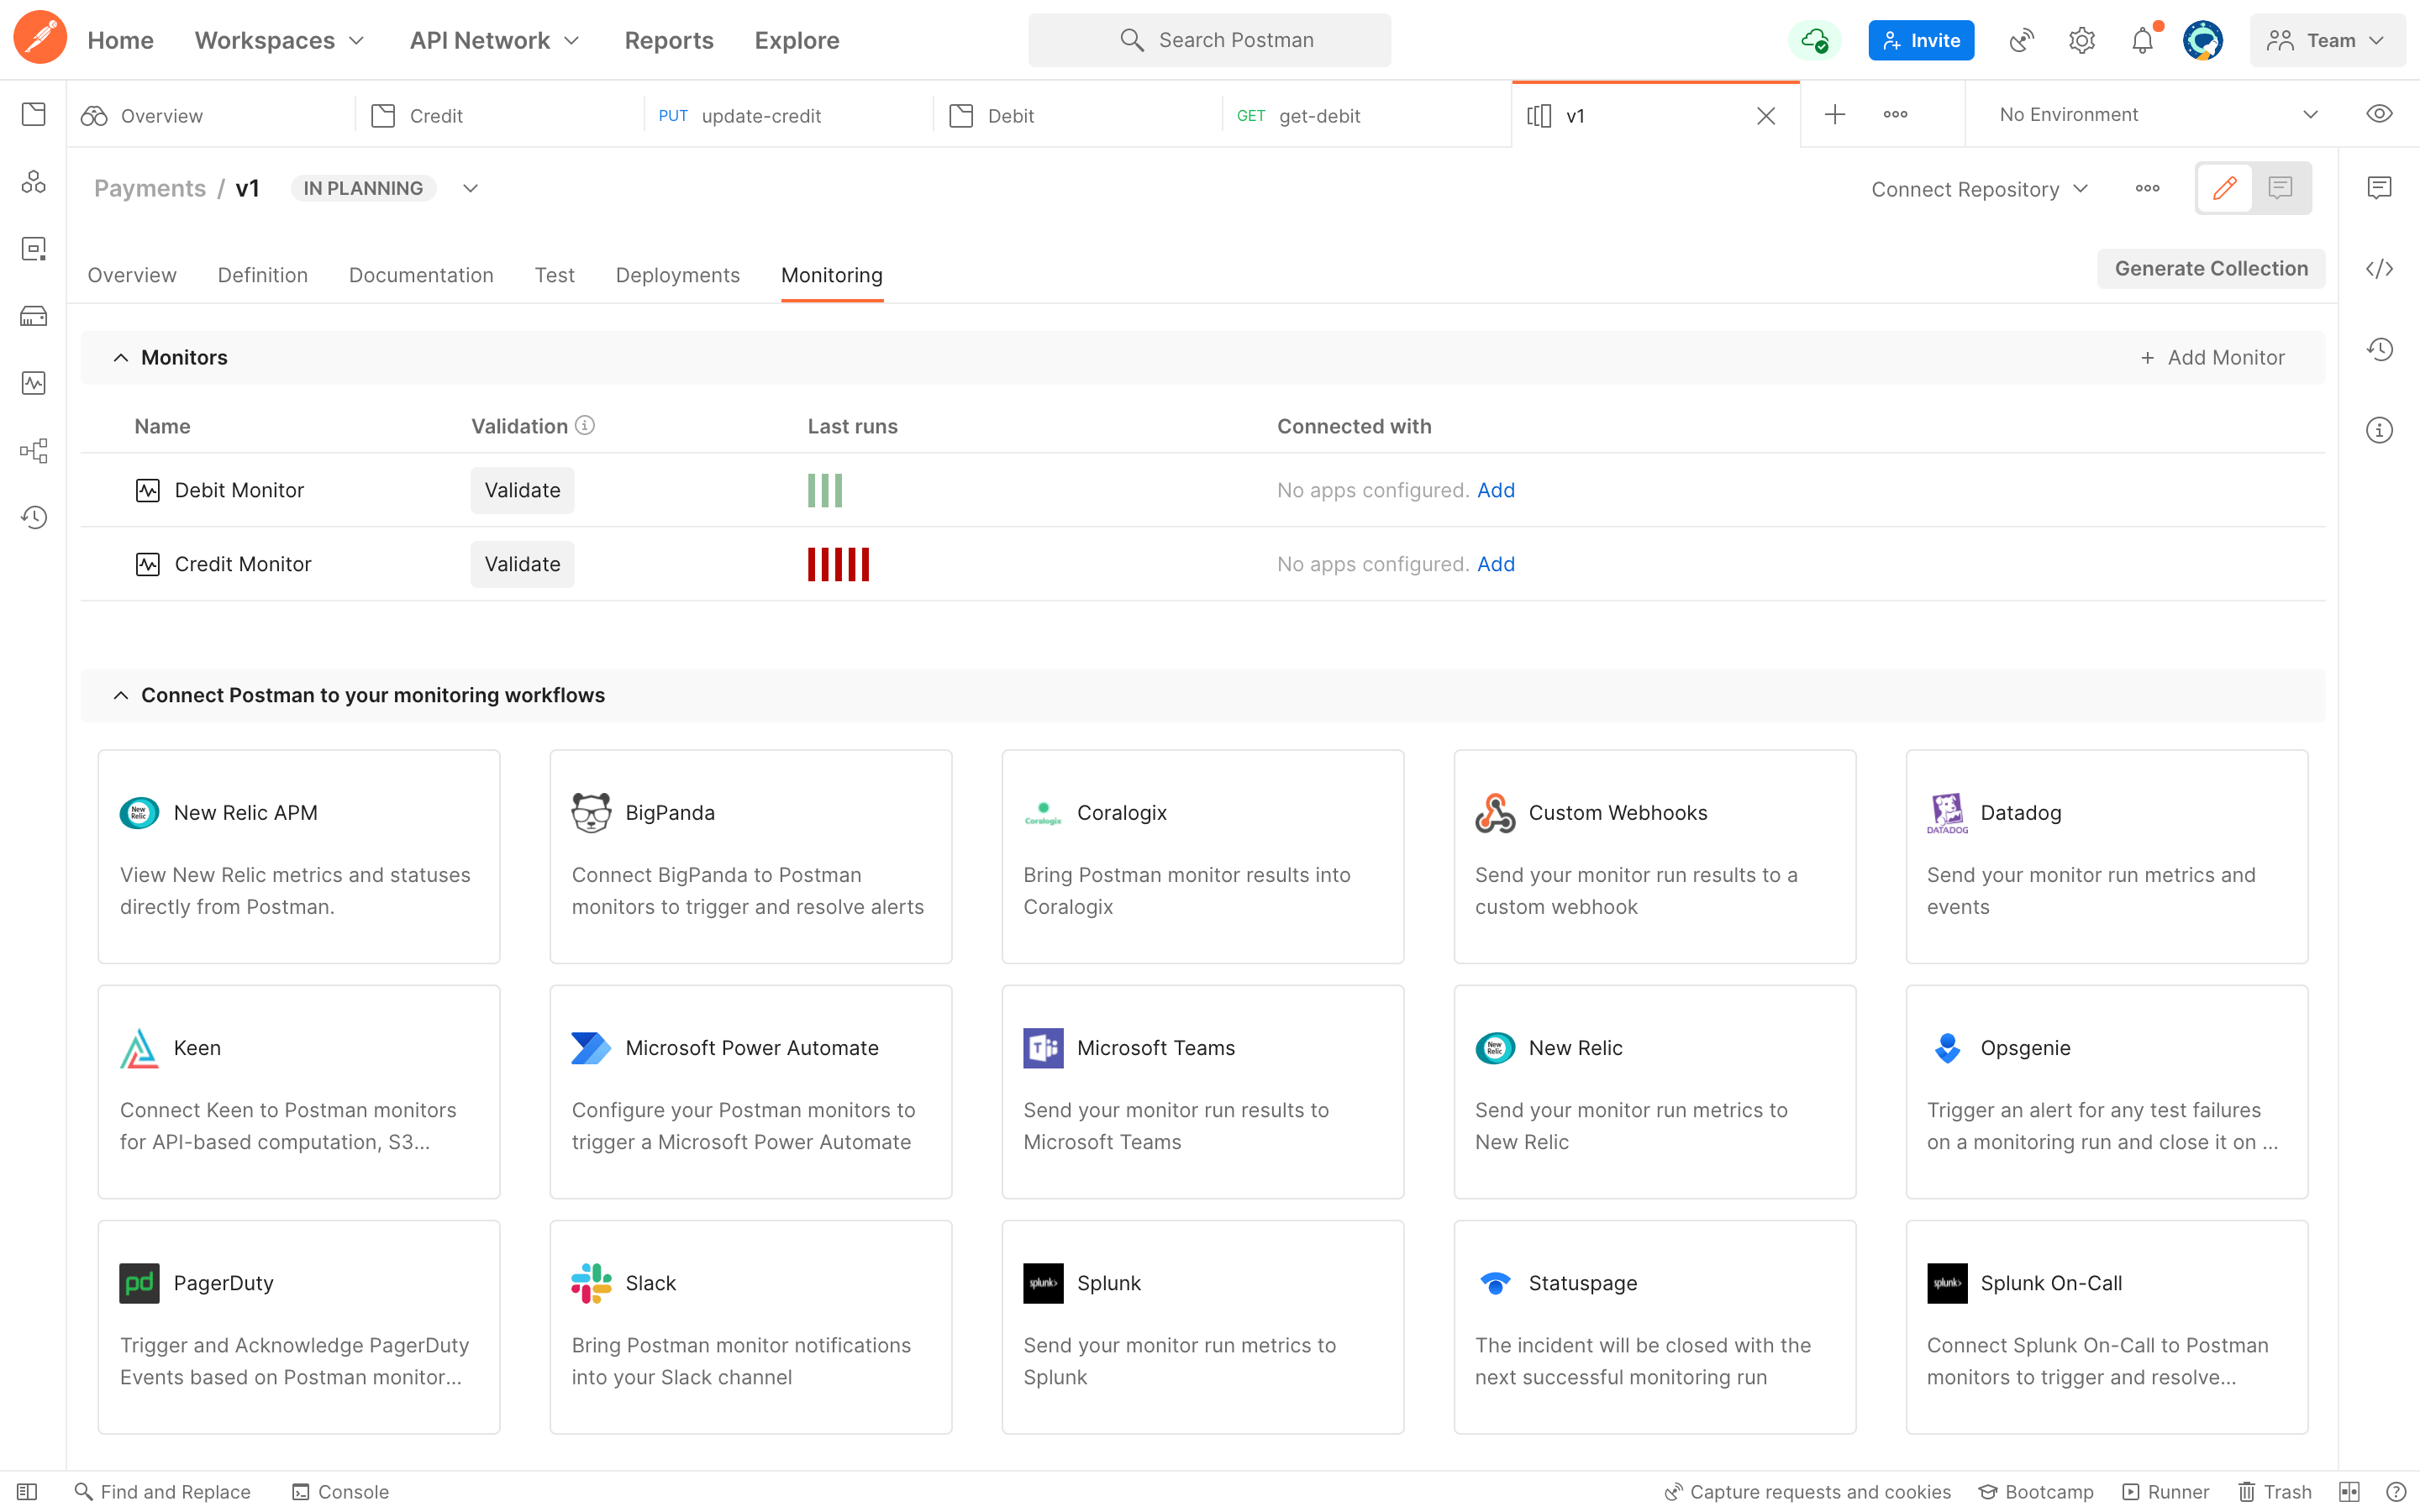
While Postman’s monitoring feature allows you to monitor API performance and quality in detail, we now also provide you a glance at important information such as the monitor run status and failed test counts closer to the API. This lets you stay aware of any unwanted behavior in the APIs so that they can be investigated in detail if needed. You can also connect to external tools to send monitor run information and fetch important information about your API and its infrastructure from these tools.
Check the status of the component and incidents on Statuspage
Incident management and reporting tools are great ways to keep your API’s consumers informed of any issues with your service. Postman allows you to connect your API monitor to incident management tools, including Statuspage. Monitors, on failure, can update the status of components you choose. This new feature lets you look at all linked components and their status while providing a quick way to navigate directly to the incidents on Statuspage.
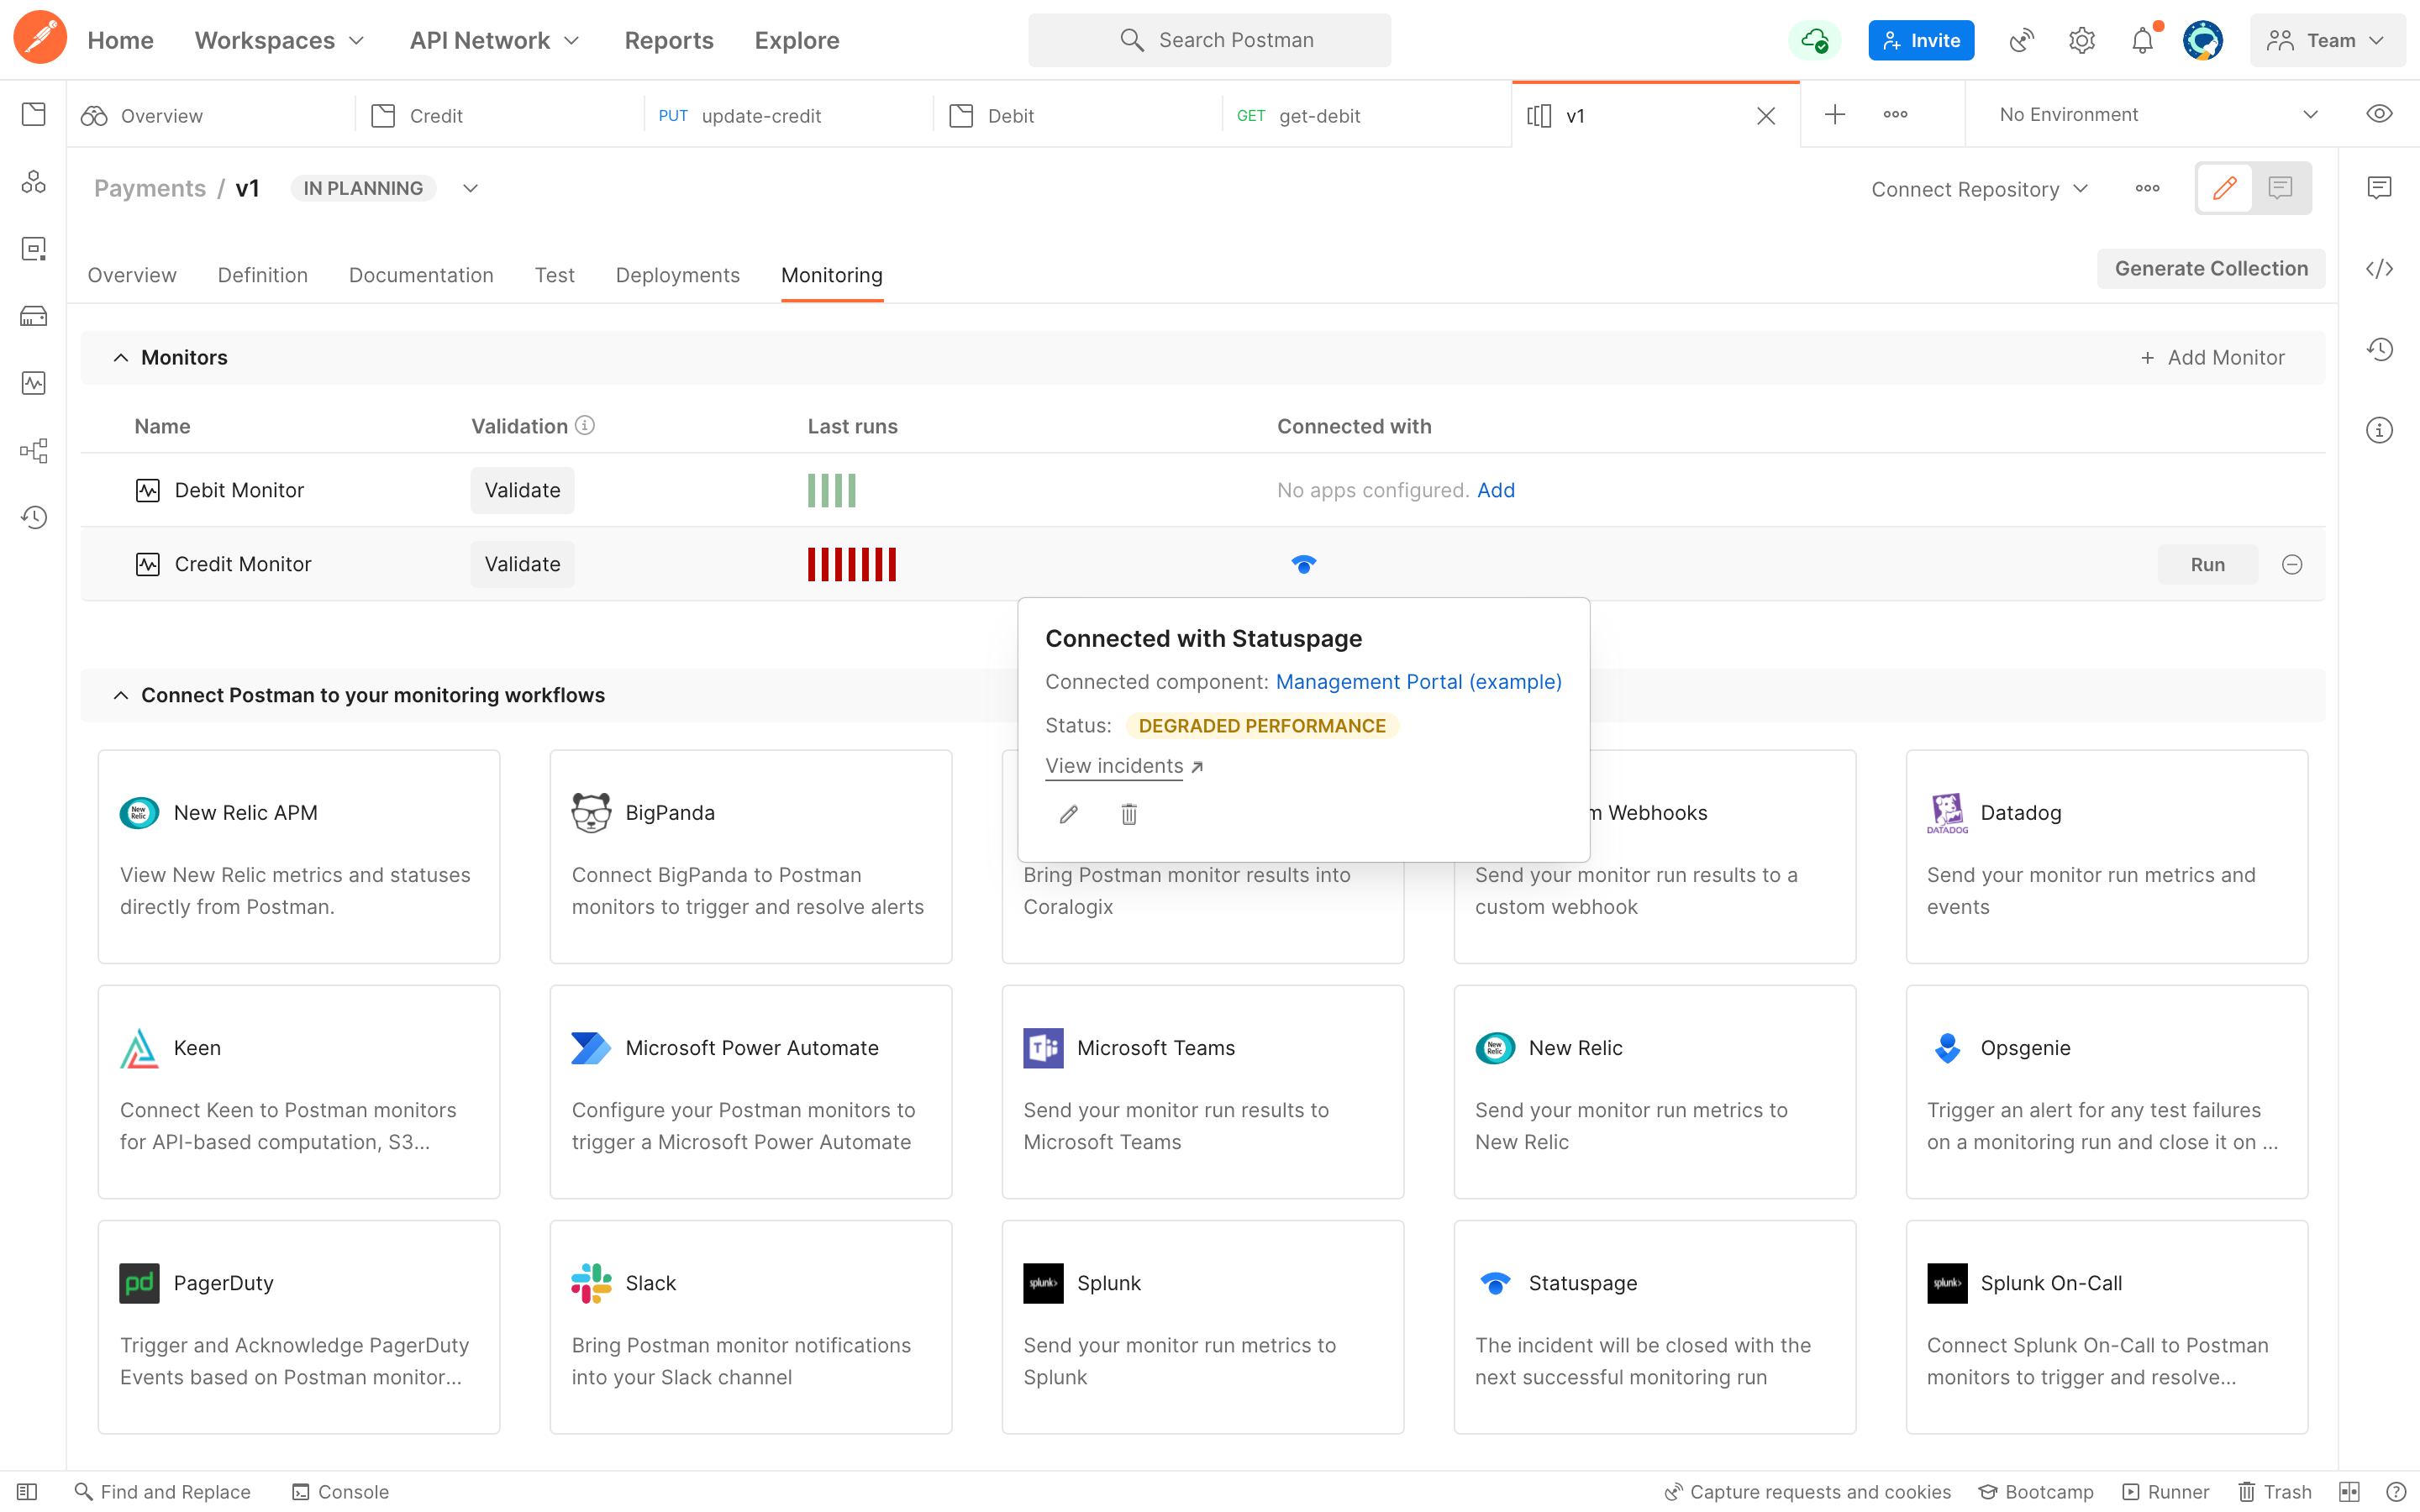
Apart from Statuspage, you can also connect to Opsgenie, Pager Duty, and Splunk On-Call.
Send monitor results to Datadog and view Datadog metrics
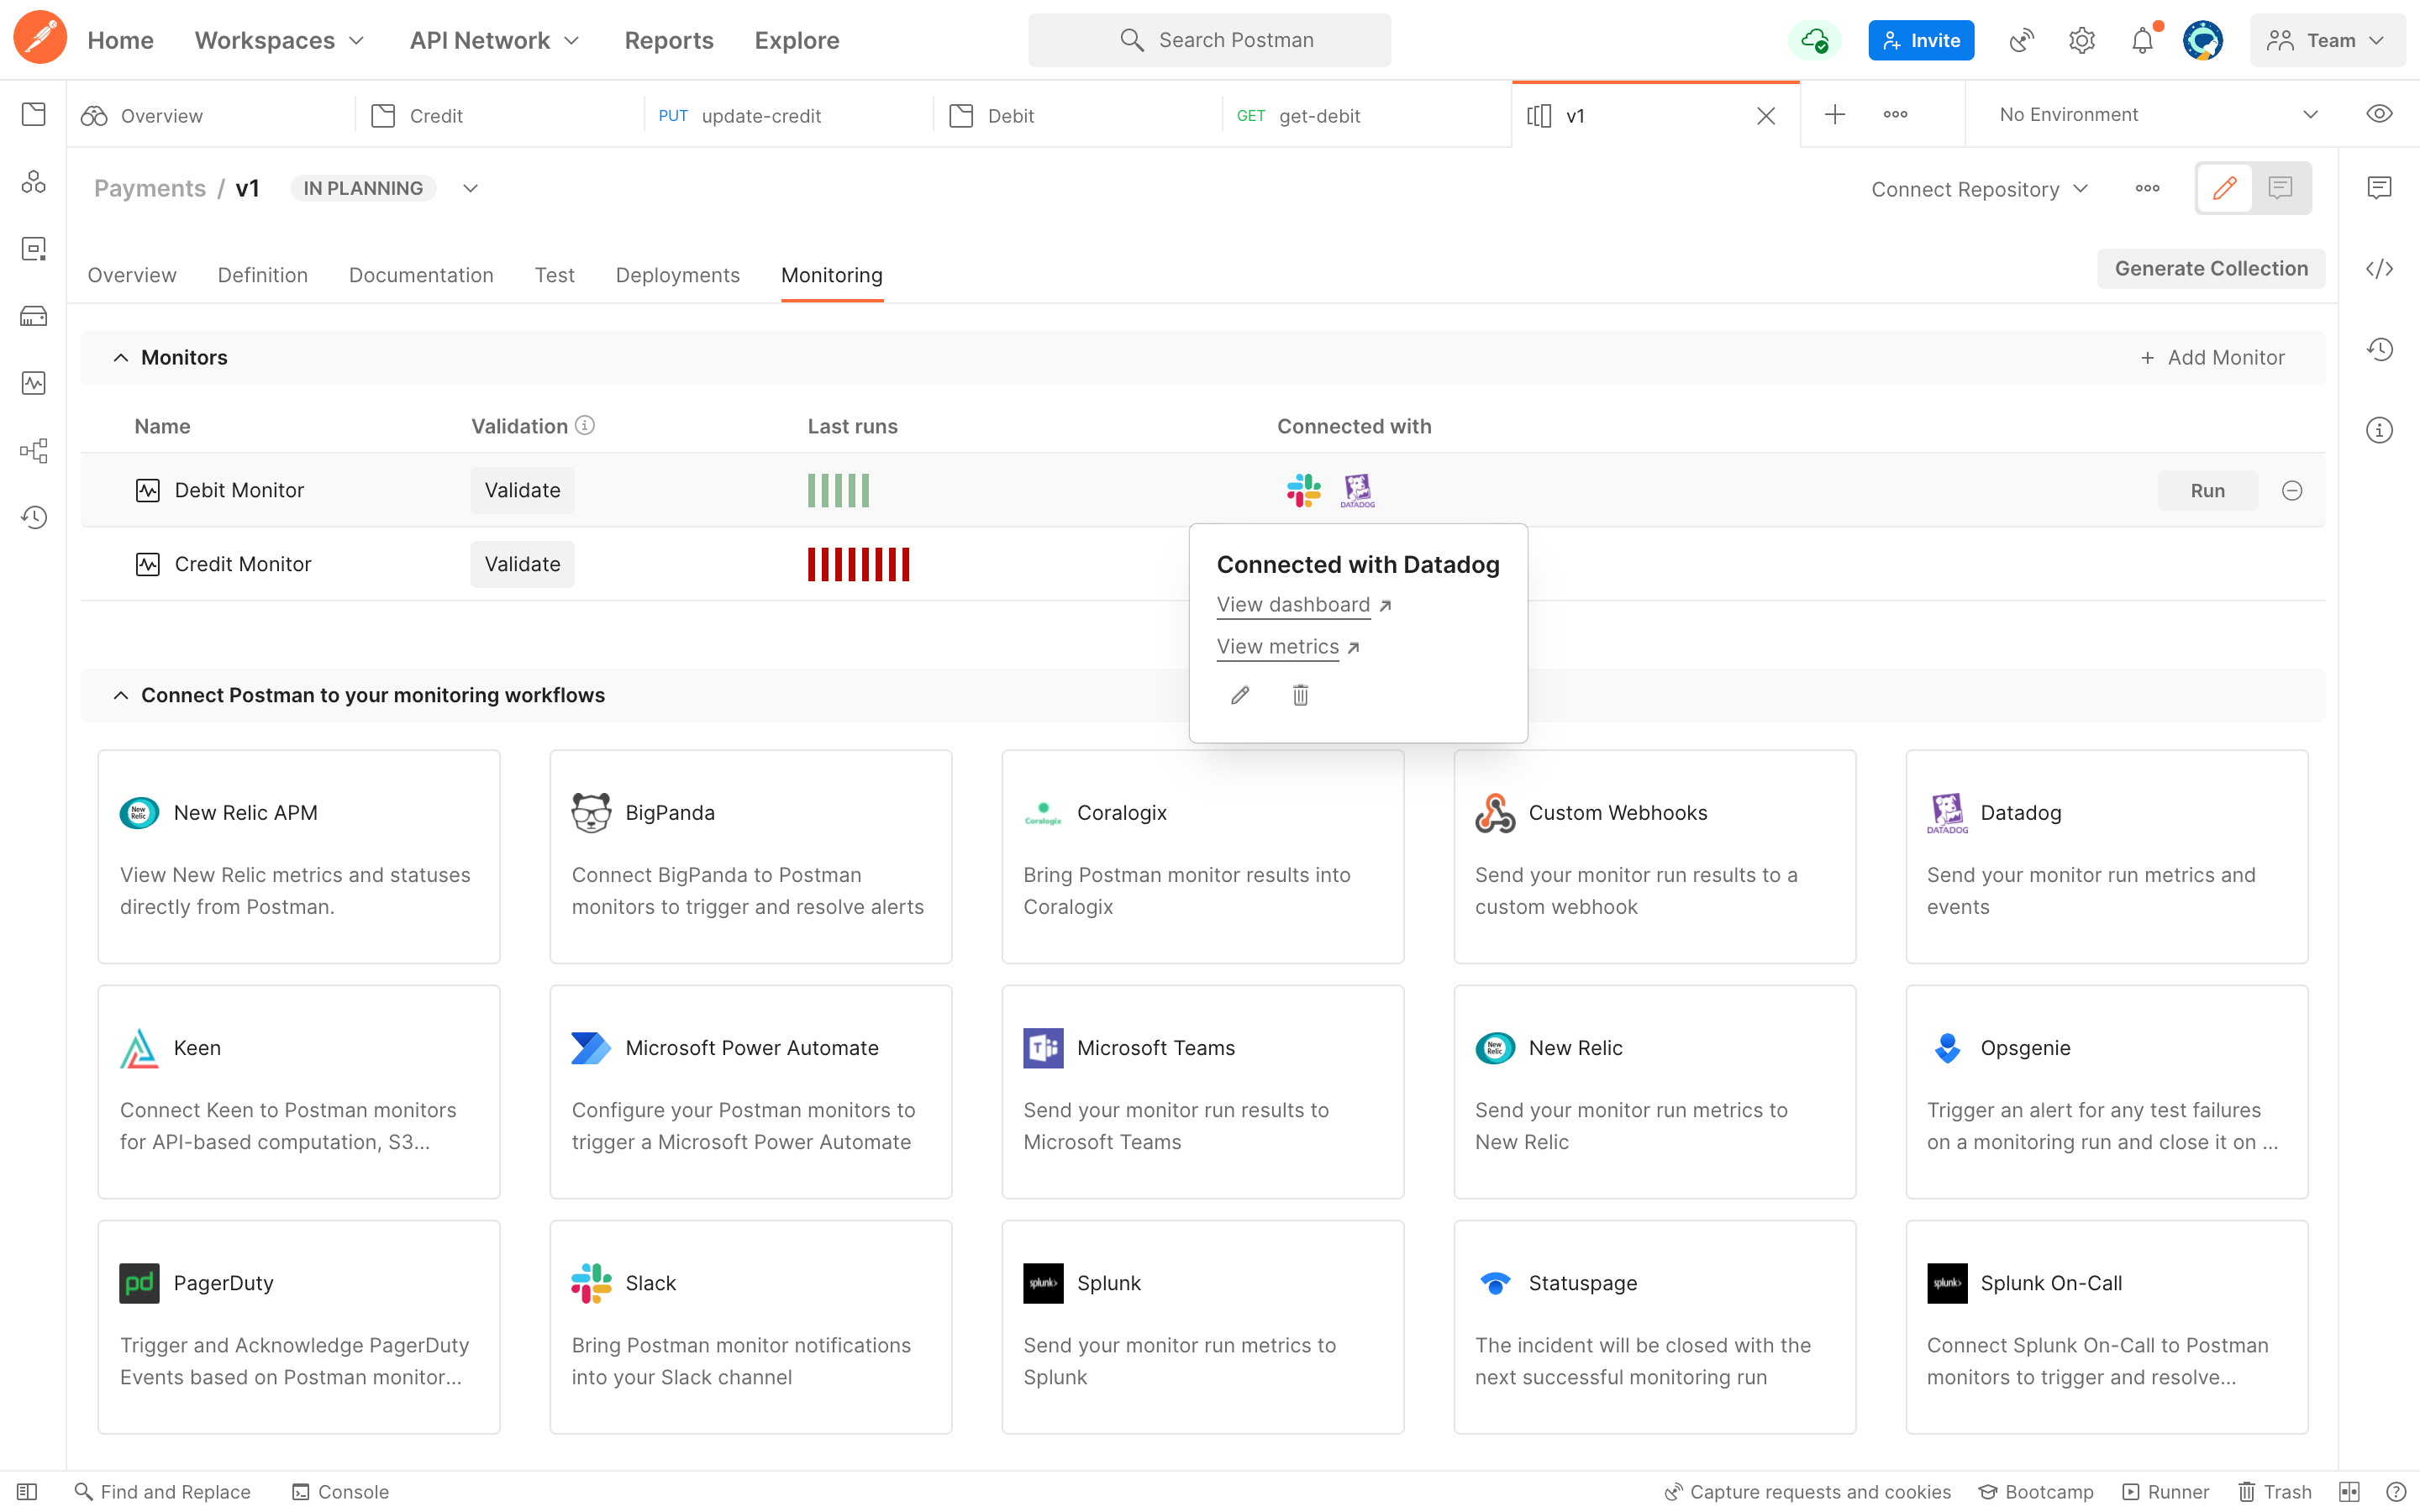
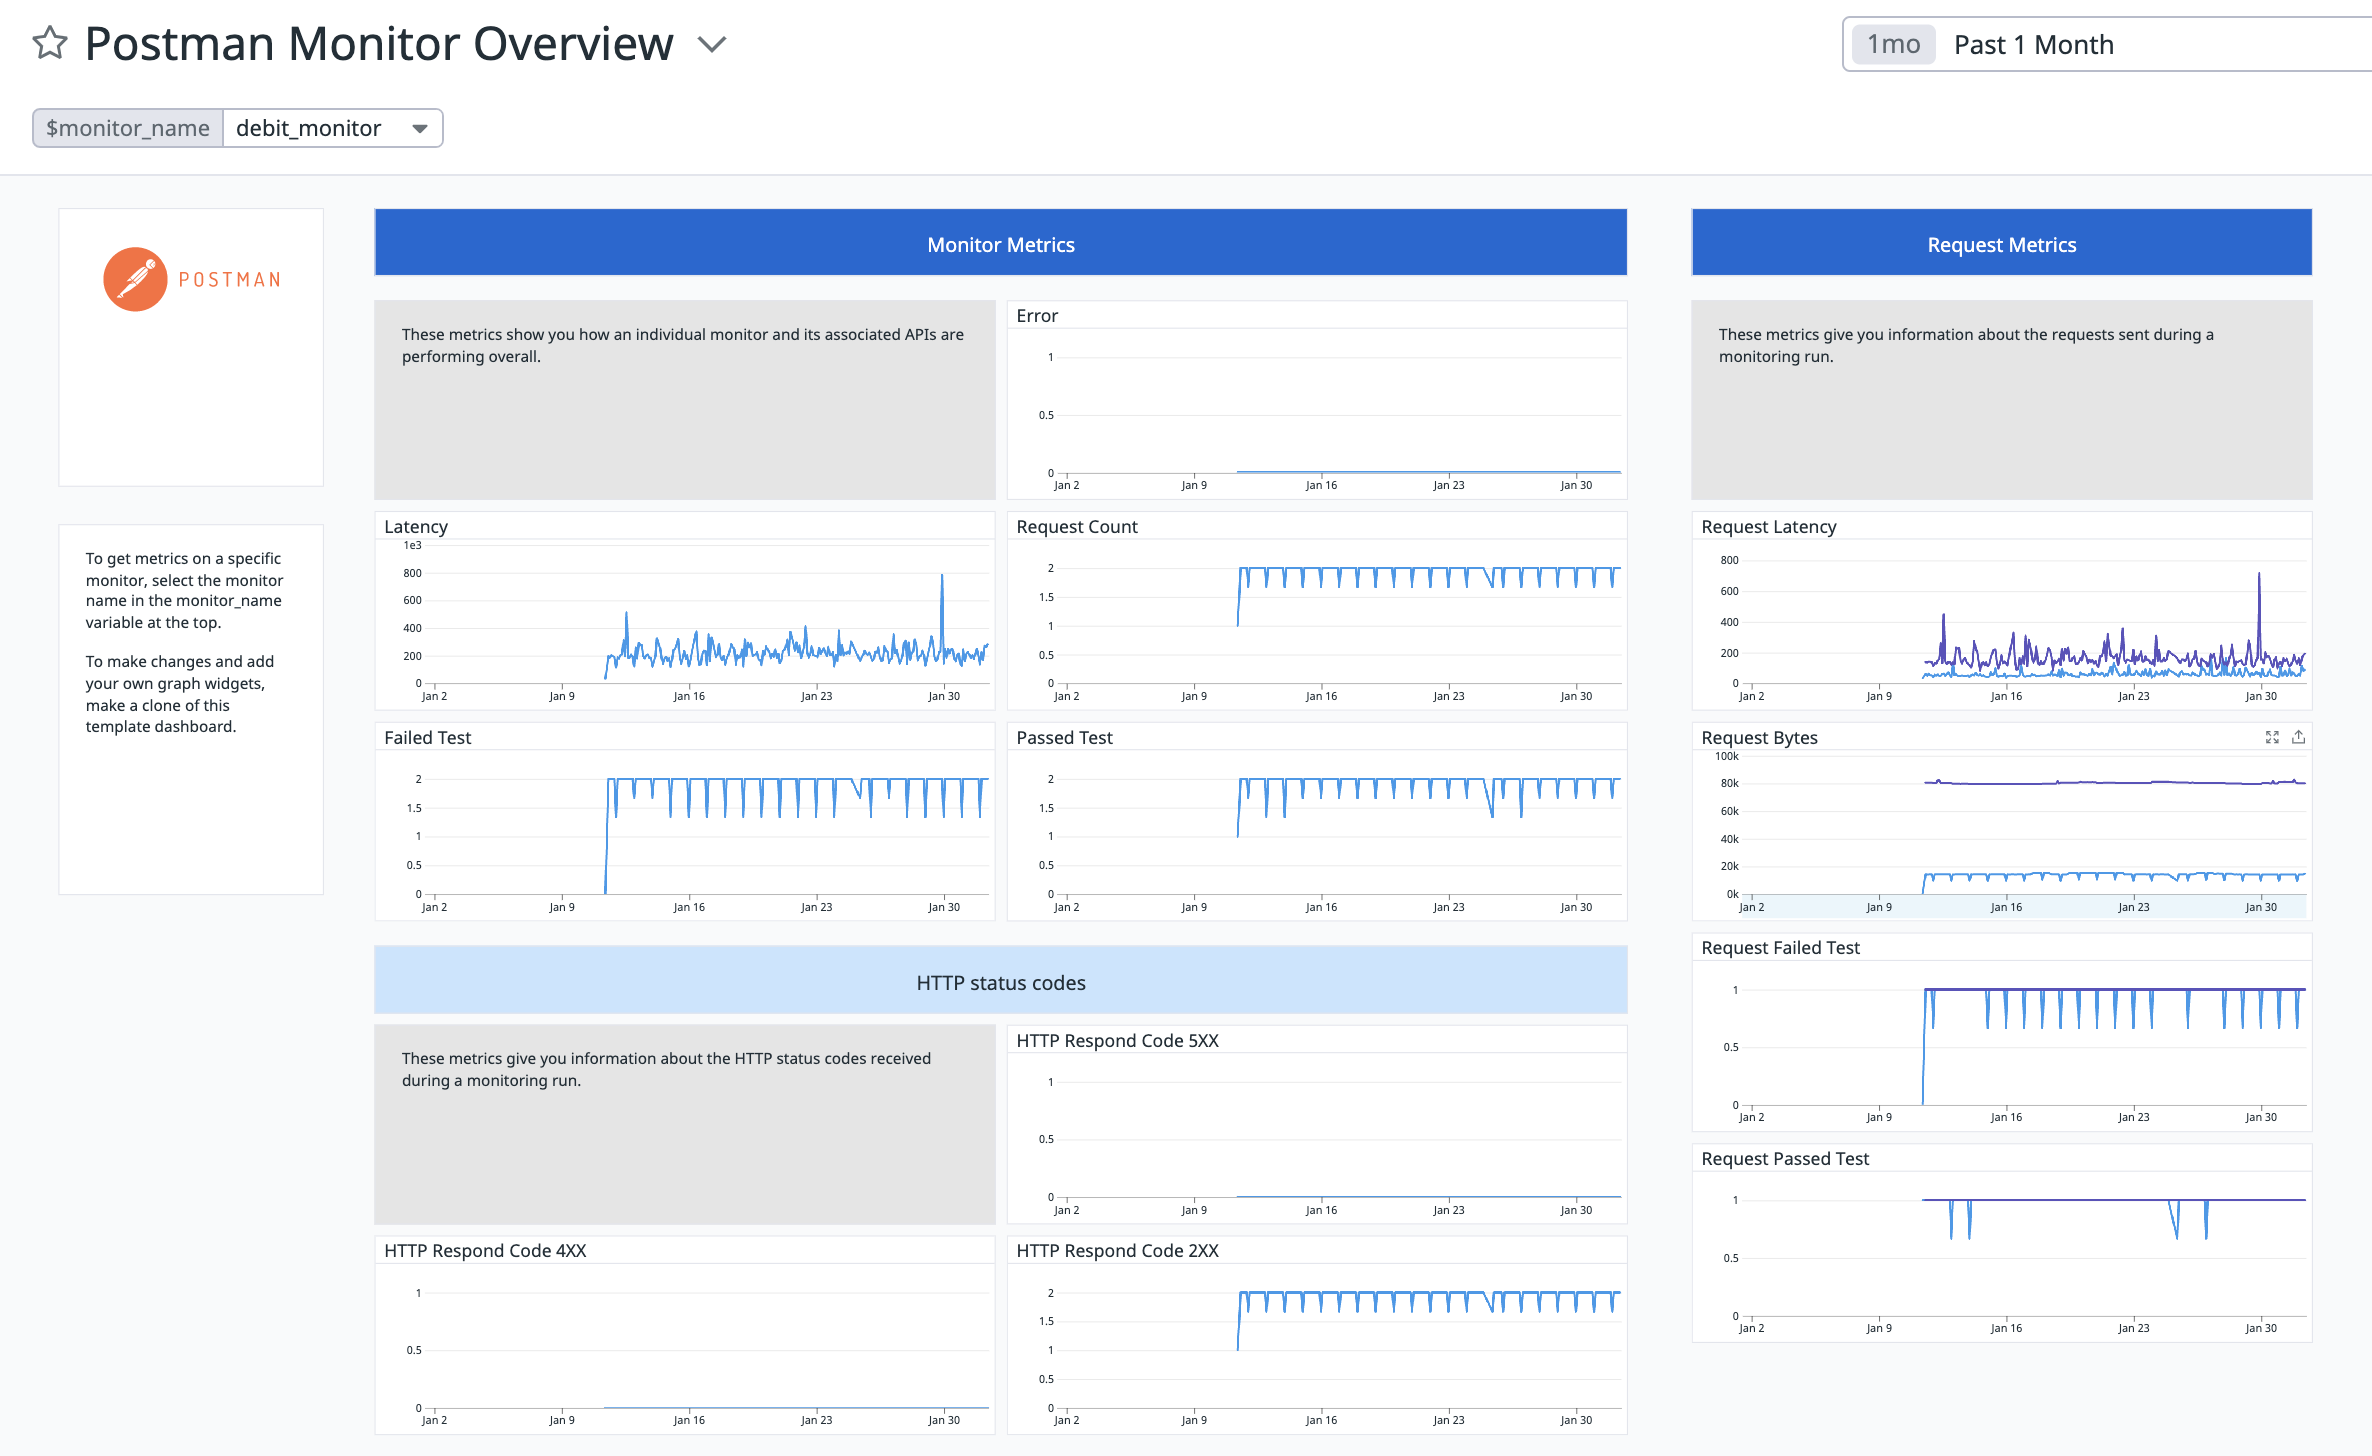
API metrics are stored and analyzed along with other metrics in observability systems like Datadog. Postman allows you to send critical metrics such as latency, error rate, to Datadog. You can also directly navigate to the summary of metrics and a pre-configured Postman dashboard on Datadog.
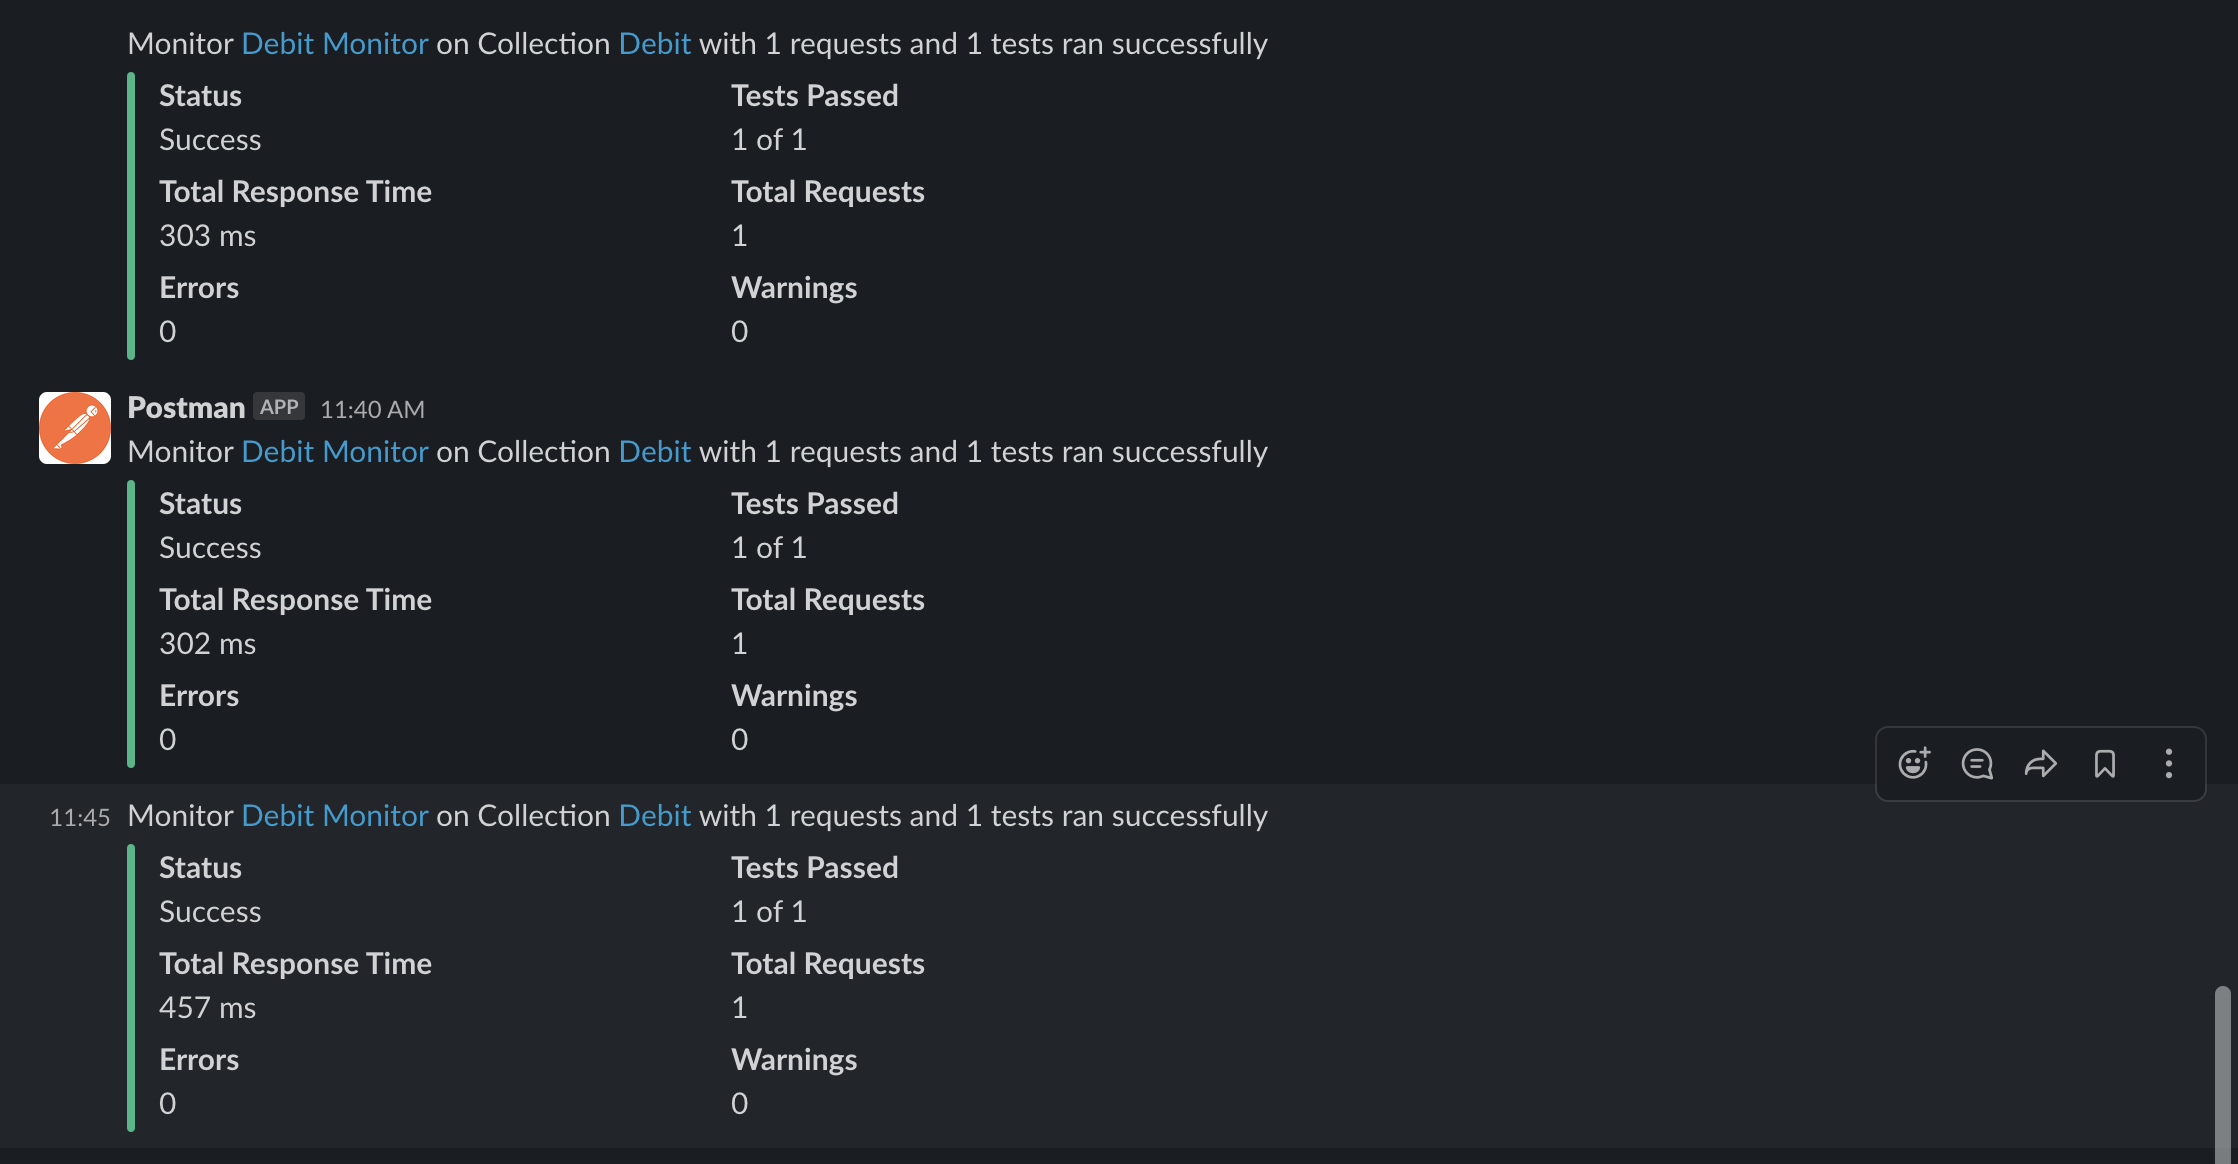
Send monitor results to Slack
Postman allows you to send monitor run results to a Slack channel. With different people collaborating on the APIs, users have found it difficult to aggregate data from different monitors. With the latest release, we bring this information upfront, showing you all the Slack channels to which the monitor run results are sent. This allows different users to quickly go to the channel where historic monitor run results can be found.
We hope this release brings you closer to effective monitoring of your API. We’re always working to improve our monitoring product and welcome feedback. Reach out to us at [email protected], on our user community, or via our issue tracker.


What do you think about this topic? Tell us in a comment below.