What is API latency?
API latency is the amount of time it takes for an API to respond to a request. Elevated API latency can negatively impact your end-user’s experience and lead to churn, which makes it an important metric to monitor when assessing your API’s overall performance.
Here, we’ll clarify the relationship between API latency and API response time, before reviewing some of the most common causes of elevated API latency. We’ll also discuss some best practices for measuring API latency—and highlight how the Postman API Platform enables you to monitor latency throughout the entire API lifecycle.
What’s the difference between API latency and API response time?
Some people get confused when asked to distinguish between latency and response time. In actuality, these terms refer to the same thing: the amount of time that passes—from the client’s perspective—between the moment a request is sent and the moment the response has been fully processed.
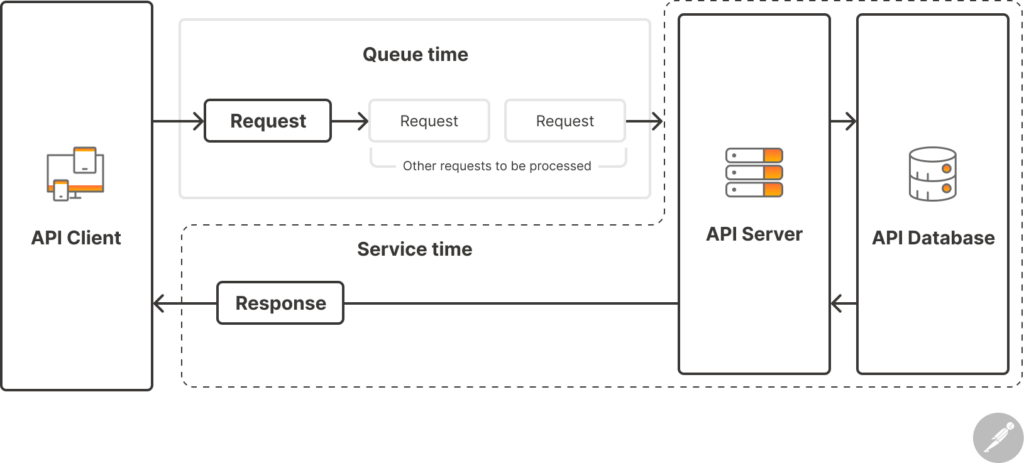
The more interesting—and important—distinction to make is between latency and service time. The latency for a single API call should be calculated by adding two values together: the queue time and the service time.
- Queue time: (Time between the start of sending a request from the client and the start of the server processing the request) + (time between the end of the server sending the response and the end of the client processing the response)
- Service time: Time between the start of the server receiving the request and the end of the server sending the response
Many API producers, when they talk about their API’s latency, are actually talking about its service time. However, this approach fails to account for the amount of time that elapses before and after the request is actually processed. This queue time is non-negligible in production applications that regularly handle large volumes of concurrent requests. Instead, it’s important to consider latency from the client’s perspective, which involves measuring the total time it takes for a request to be sent, queued, processed, and responded to.
What are the causes of elevated API latency?
There are many factors that can contribute to API latency, and diagnosing the issue may require a careful investigation that spans each layer of the tech stack. Some common causes include:
- Network latency: Network connectivity issues or high network traffic can significantly increase API latency. If data must travel a long distance between the client and server or if there are issues with the network infrastructure, it can result in delays.
- Server overload: When the API server becomes suddenly inundated with requests, it may struggle to process them all in a timely manner, leading to increased latency. This problem can be compounded by inadequate server resources, such as CPU, memory, or disk I/O.
- Inefficient code: Certain coding patterns—such as algorithms with high time complexity, unoptimized SQL queries, and synchronous operations—can significantly slow down response times.
- Third-party dependencies: API integration enables developers to incorporate third-party functionality—such as payment processing, geolocation services, and messaging—into their applications. However, if these external dependencies experience downtime, it can lead to increased latency in the APIs and applications that rely on them.
- Geographic location: The physical location of the API client and server can contribute to an API’s latency because data transfer is not instantaneous. It is instead limited by the speed of light and the characteristics of the network infrastructure.
- Throttling or rate limiting: APIs often implement rate limiting or throttling to control the number of requests that a single client can make. When clients exceed these limits, they may experience delays or receive errors.
How can you measure and test API latency?
API latency plays a significant role in an API’s overall performance, and an effective API monitoring strategy can help you identify latency spikes and trends, as well as their root causes. Some best practices for monitoring API latency include:
- Account for both queue time and service time: As discussed above, it’s important to include the amount of time that elapses before and after the request is actually processed (i.e., the queue time) when measuring latency. This approach helps ensure that your understanding of your API’s latency is aligned with the client’s actual experience.
- Consider different scenarios: An API’s performance can be affected by a variety of factors, so it’s critical to monitor latency under normal usage, peak traffic, and worst-case-scenario error conditions to ensure your API will perform adequately in the real world.
- Set SLAs: Service Level Agreements (SLAs) define acceptable latency thresholds that can help you keep track of whether your API meets performance expectations over time. They can also help establish trust with your API’s consumers, whose business goals may be contingent on your API’s performance.
- Test throughout the API lifecycle: Tests that confirm whether an API responds in an appropriate amount of time should be executed throughout the entire API lifecycle. This approach can help you catch latency-causing issues before they escalate and become ingrained in the API’s implementation.
- Use a code profiler: Profiling tools work by analyzing the execution of your code, highlighting areas where optimizations can be made to reduce latency. This helps you make data-driven improvements to your API’s performance.
How can Postman help you reduce your API’s latency?
The Postman API Platform, which was recently named “Best in API Management” in API World’s 2023 API Awards, includes several features that enable teams to test, monitor, and reduce their API’s latency. With Postman, you can:
- Test your API’s response time under real-world conditions: Postman’s API performance tests enable you to simulate real-world traffic and monitor key performance metrics—including latency. You can also drill down into any test execution in order to troubleshoot concerning results.
- Test and monitor API response times: Postman Monitors allow you to easily test the response time of individual requests. These monitors can be run manually, on a schedule, and in various regions, as well as within CI/CD pipelines.
- Visualize monitor data on a filterable dashboard: Postman displays the results of every monitor run on a built-in dashboard, so you can spot performance trends at a glance. The dashboard can be scoped to individual requests, run types, results, and regions, so you can troubleshoot more efficiently.
- Forward API performance data to other observability tools: Postman integrates with several third-party observability tools, such as Datadog and New Relic, which allows you to correlate data from your Postman Monitors with other telemetry data from across your environment. These integrations also enable you to easily incorporate API monitoring data into your on-call and incident response workflows.


What do you think about this topic? Tell us in a comment below.