
How to Monitor Your APIs Using Postman and Datadog
Monitoring your APIs is an essential part of the API management process. While Postman monitors let you keep a check on your API performance and stability, our enhanced integration with Datadog—an API performance monitoring tool—enables you to perform further analysis by logging, alerting, and dashboarding. Plus, this integration in conjunction with Postman asserting allows you to closely monitor your business logic.
Here’s how this integration works: Postman posts the monitor run results to Datadog. The results can then be further analyzed to gain greater insights into your API performance and reliability. Follow the steps here to set up a Datadog integration and achieve the following use cases.
Monitor the API latency across various regions
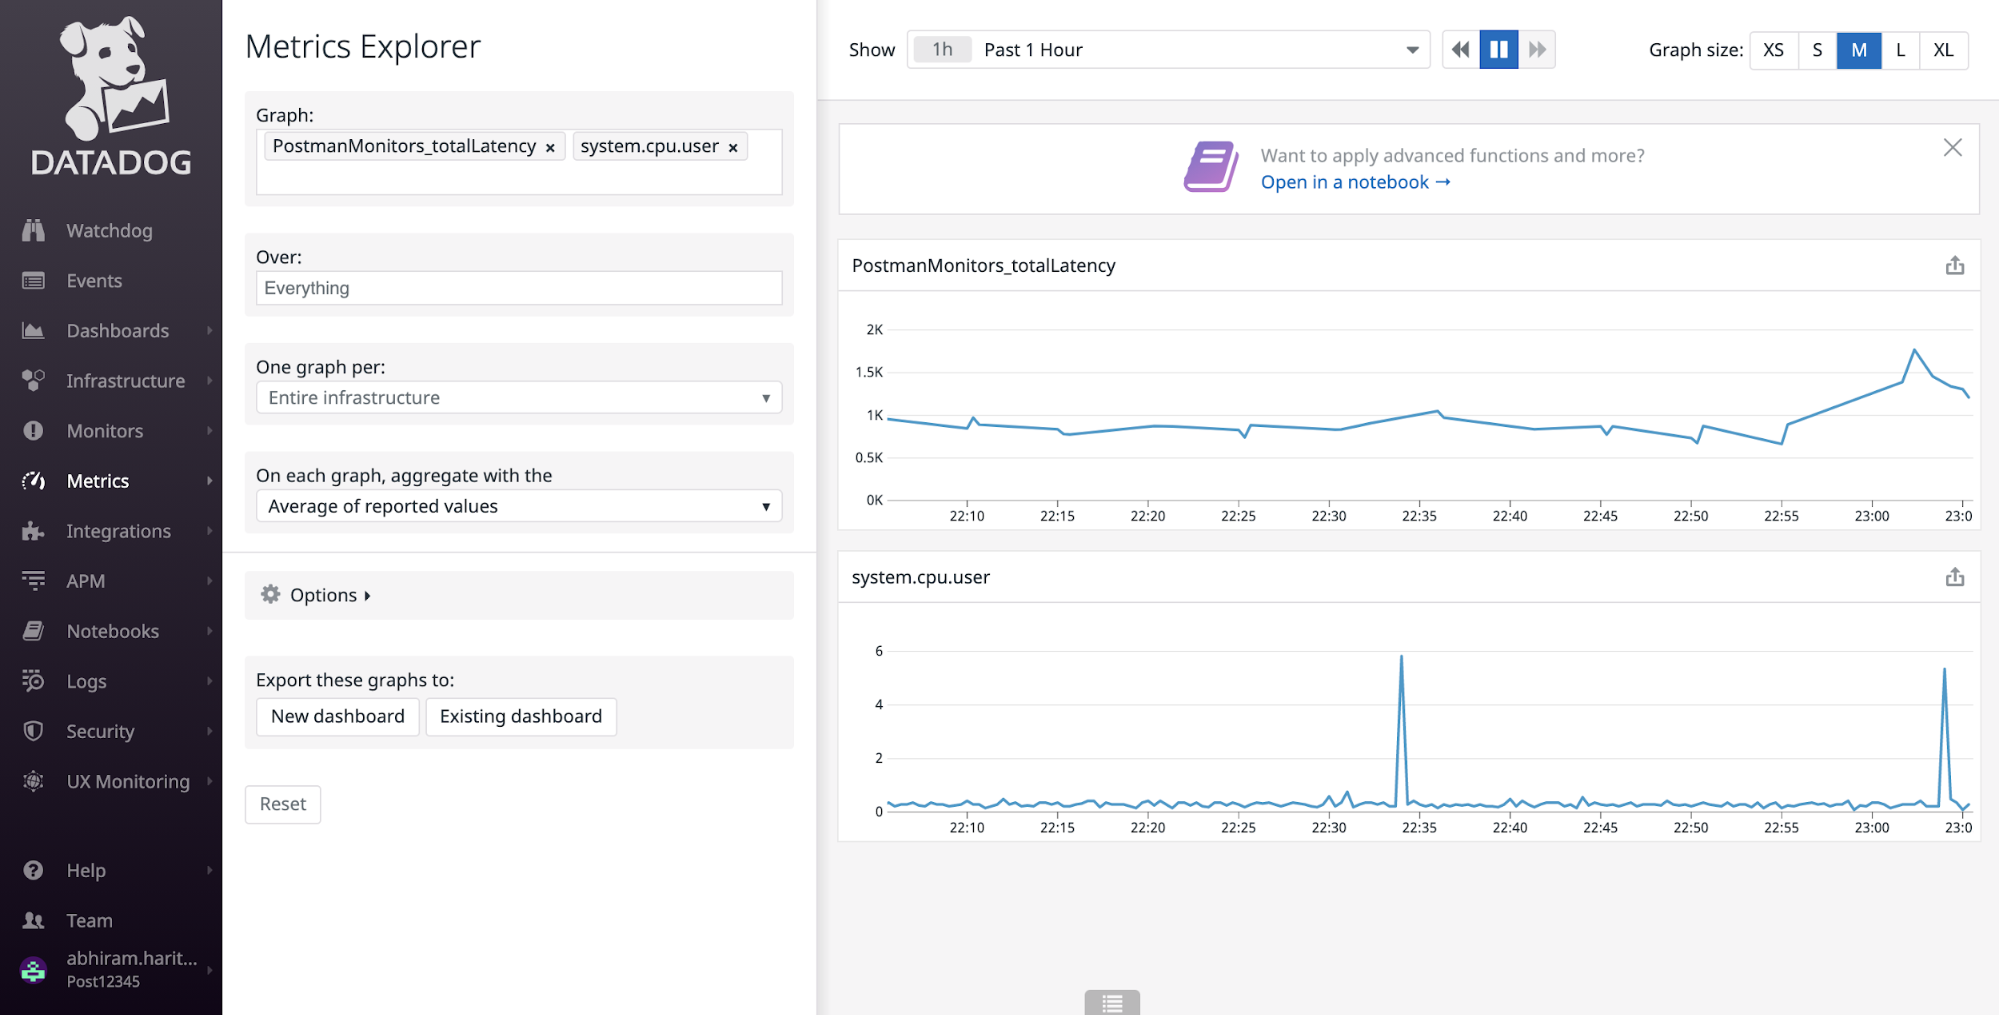
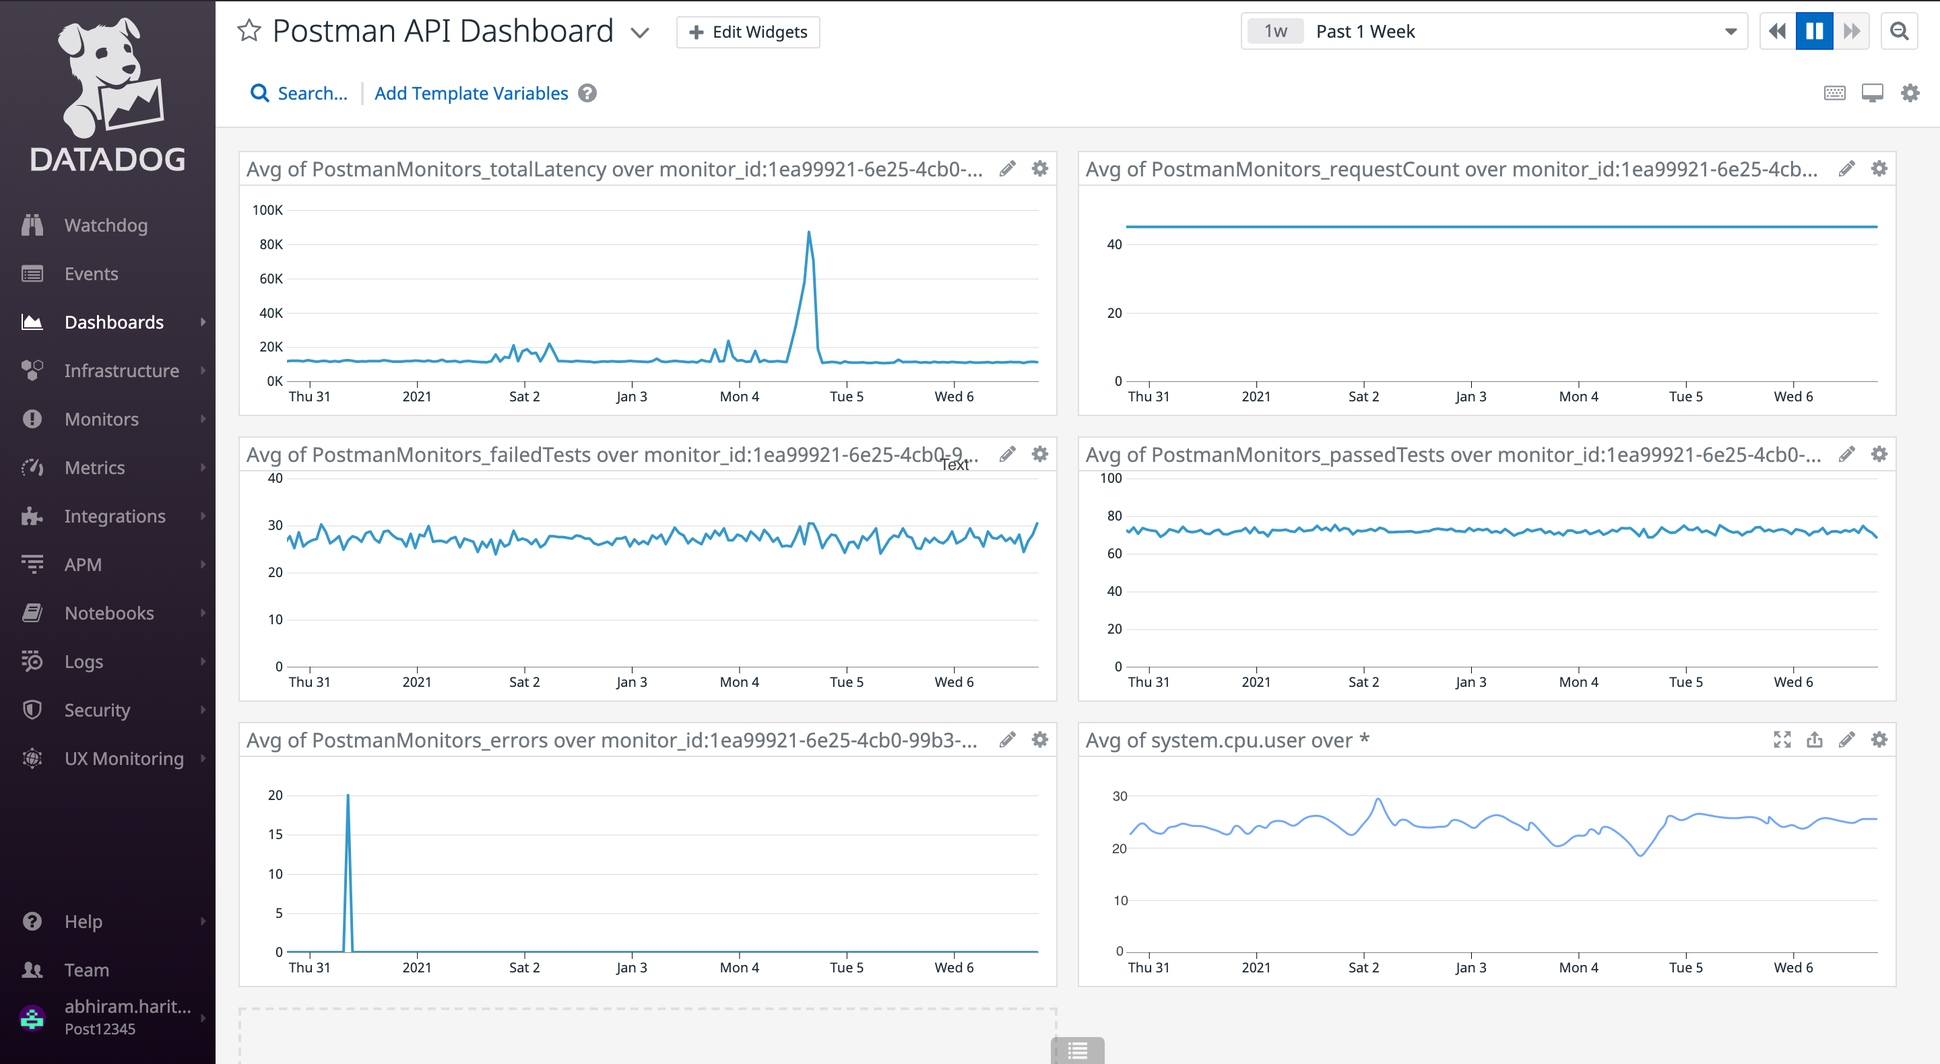
Postman sends the latency of each request as well as the complete monitor run to Datadog. The metrics PostmanMonitors_totalLatency and PostmanMonitor_request_latency can be observed to test the latency of your API across a particular “region” (which is a tag associated with the metric).
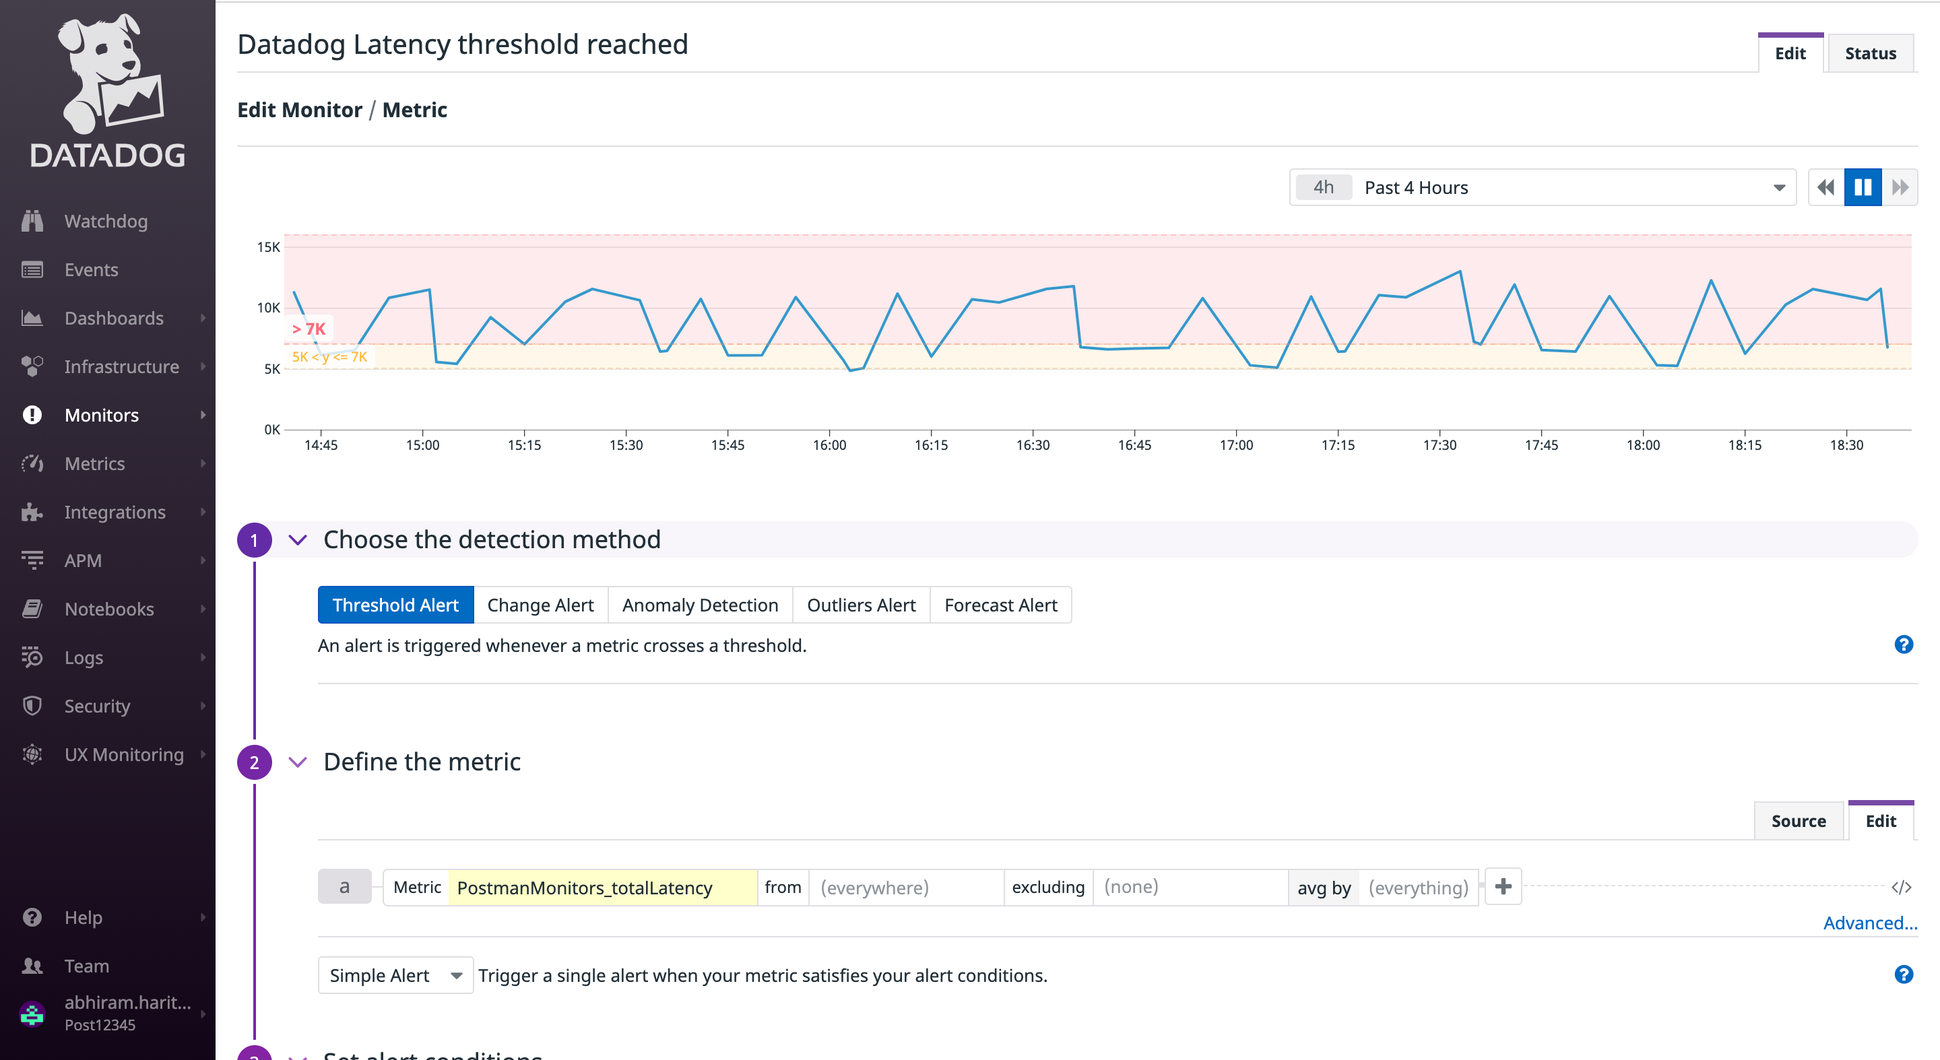
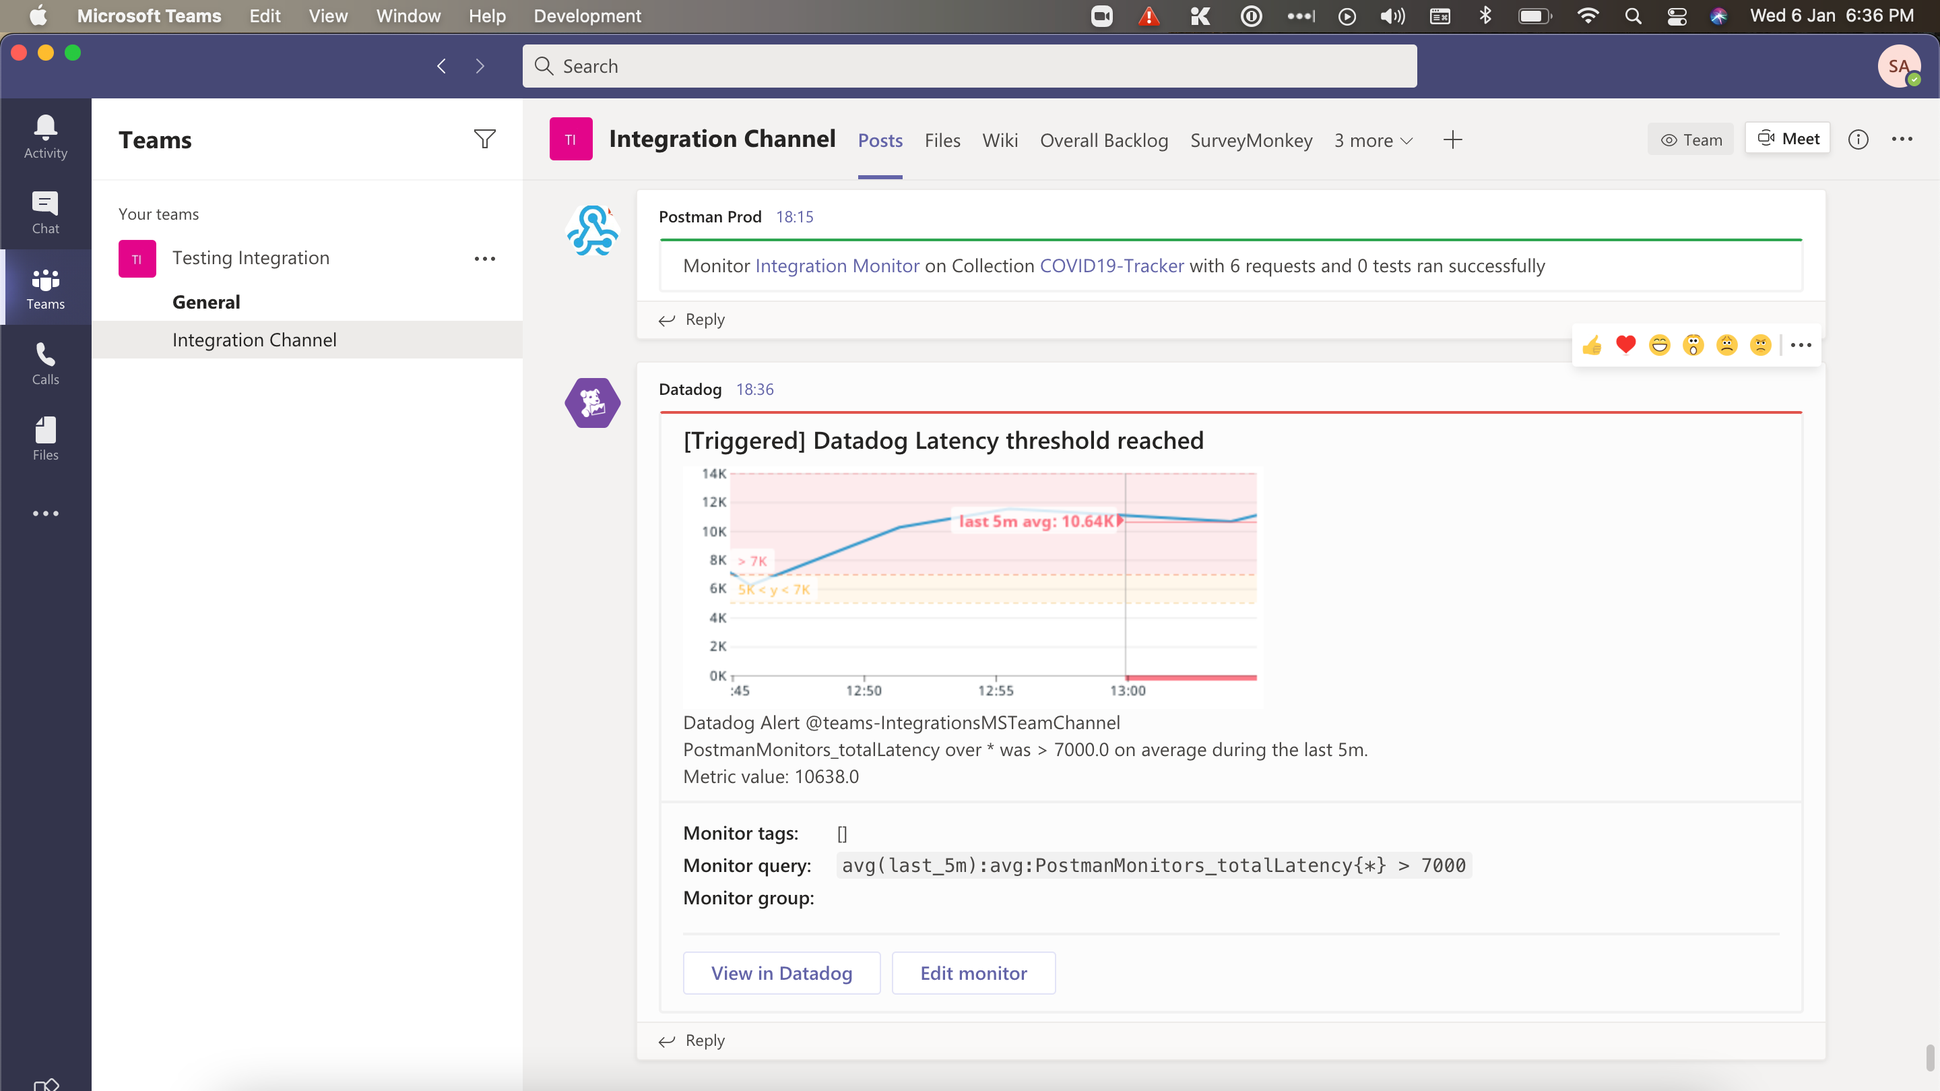
Observing these metrics in conjunction with the system performance metrics can help you detect the degradation of your API performance and take quick action. This observation helps you drill deeper into an anomaly in API performance and better understand the effects of latency on system resources and vice versa. Datadog also lets you set alerts once a metric crosses a certain threshold, so you will always be aware of any significant performance degradation.
Keep a check on errors and test-case status
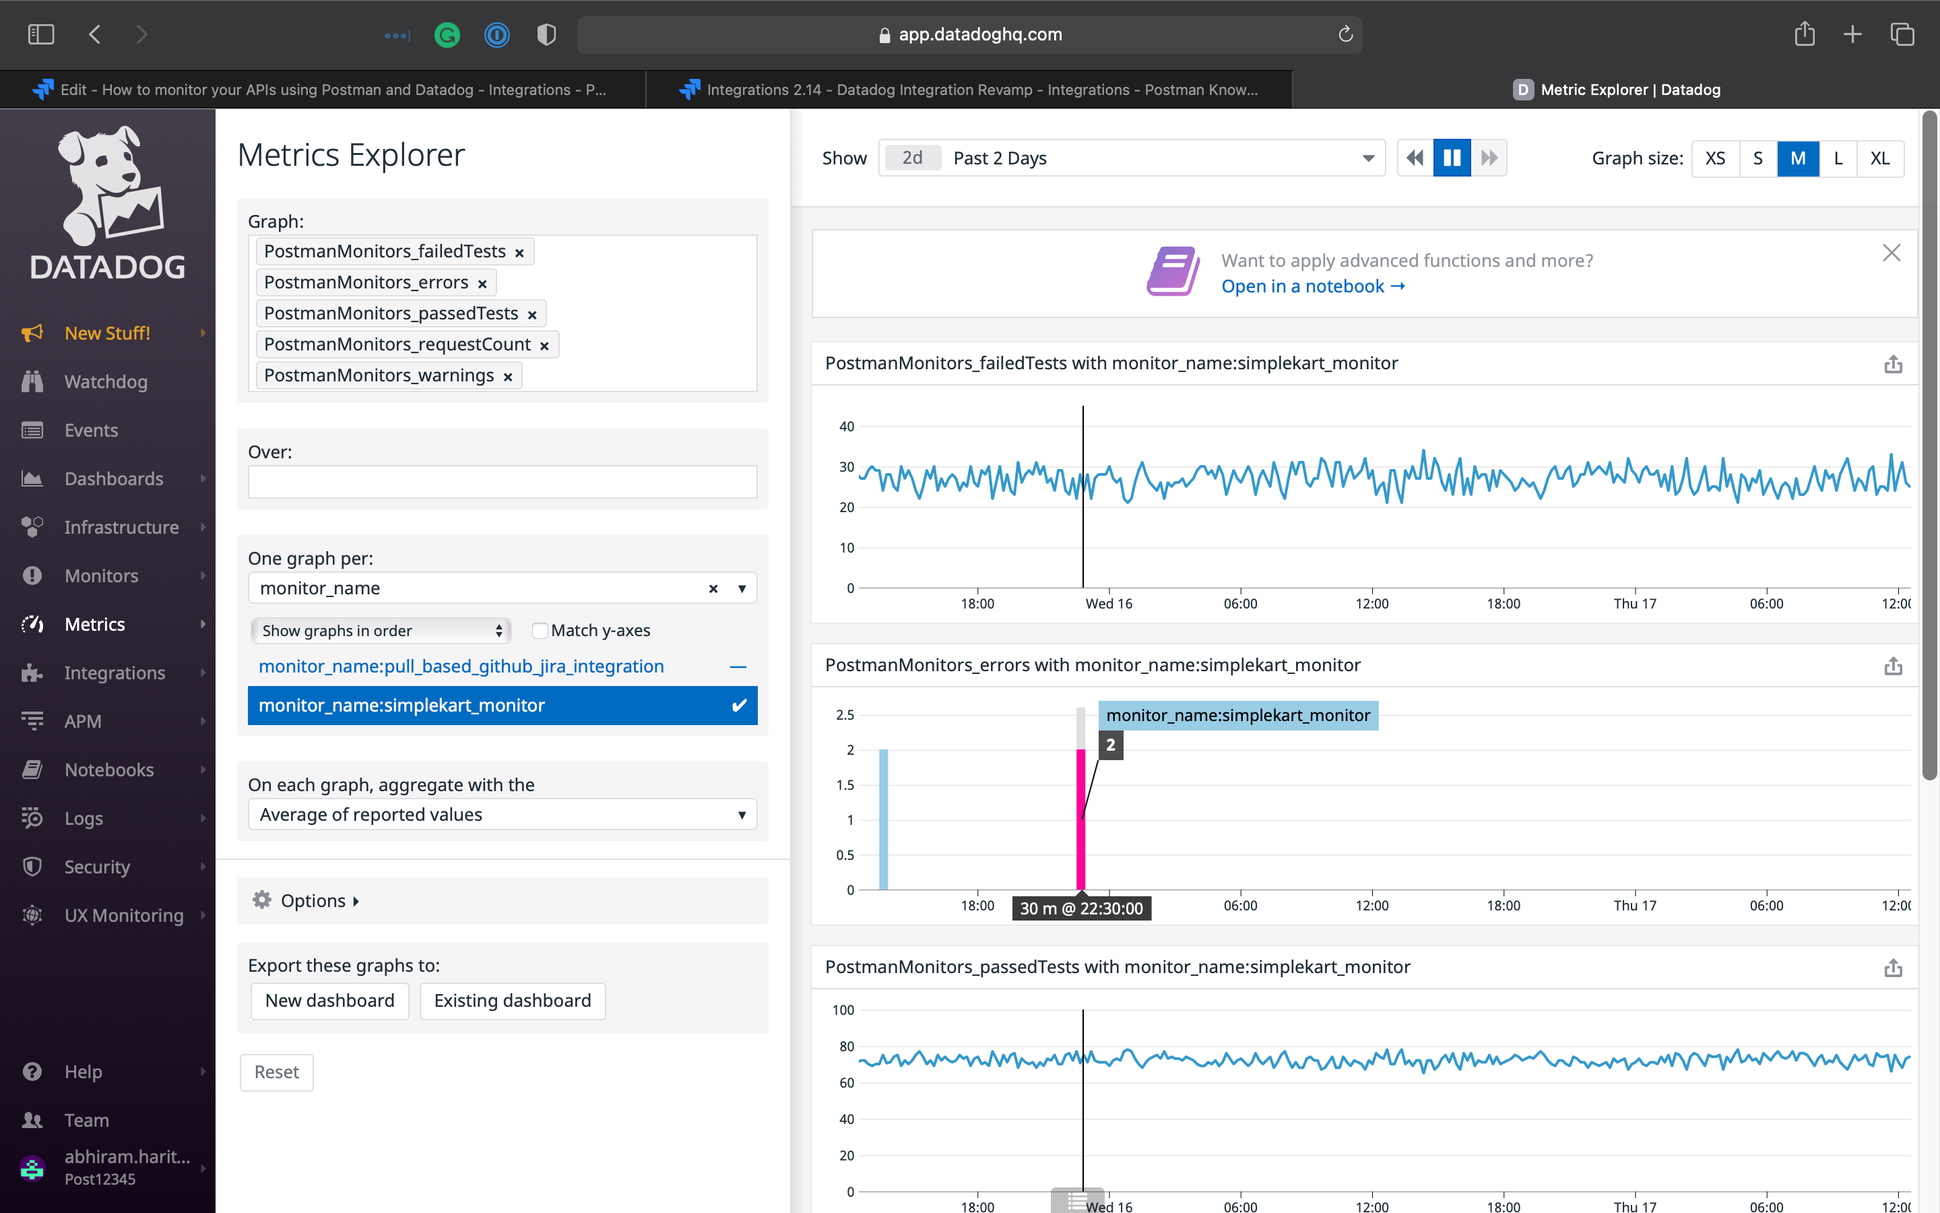
It’s important to keep a check on any unusual errors or test failures in the APIs. Postman monitors send across metrics such as PostmanMonitors_failedTests, PostmanMonitors_passedTests, PostmanMonitors_errors, and more to Datadog to keep checking for any errors or unusual test failure in your APIs.
These metrics can help you be proactive in taking corrective measures in the event of an API failure. Tracking these over time can give you a good idea of the reliability of your APIs. Correlating these metrics with other application metrics can help you identify the root cause of failures and errors.
With this latest release, we have introduced a few new request-level metrics: PostmanMonitor_request_failedTests and PostmanMonitor_request_passedTests.
Detect unusual data transfer to and from your APIs
The number of bytes sent or received by your APIs directly impacts the resource utilization of your network and system. This also in turn impacts the performance of your APIs. The new metrics PostmanMonitor_request_bytes helps you monitor closely the number of bytes being sent or received by your API over a time frame. This in conjunction with the network and system resource metrics can help you detect any adverse impacts being caused by your APIs on your network and systems. The higher resource (CPU, RAM, etc.) utilization can further have an impact on the latency metrics as well, hence the metric can indirectly answer any anomaly in the API latency metrics.
Know the availability of your APIs
API availability is one of the most important metrics that have a direct impact on your business sustainability. Postman sends across metrics such as PostmanMonitor_run_httpStatus2XX, PostmanMonitor_run_httpStatus4XX, and PostmanMonitor_run_httpStatus5XX to monitor the HTTP status of your requests. The metric in conjunction with the Datadog alerting (talked about earlier) can help you stay on top of your APIs’ availability. Also, observing the trend over a time frame will give you a good idea about your API availability, which can be correlated to business impact if there is any.
Creating a dashboard in Datadog
While all the metrics above have a standalone significance, the power of metrics increases exponentially when viewed in conjunction with each other. Datadog lets you create dashboards of related metrics, which can help you monitor your APIs and systems closely. We strongly recommend creating a dashboard corresponding to each monitor that contains all the metrics associated with that monitor and a few other systems/network resource metrics. This gives you an end-to-end view of your APIs’ performance, resilience, resource utilization, and availability.
With these enhancements to the Datadog integration, Postman now empowers you to comprehensively evaluate every aspect of your API performance and be more proactive in taking corrective measures when needed. Try out the upgraded integration and let us know what you think.


i want to learn and usesing postman
I integrated my API with Datadog from Postman. I can see only success and failures only but i’m not able to see the log details in my datadog dashboard.
Can any one help me how to check