
Postman Is Now a Datadog Technology Partner: More Integration Features
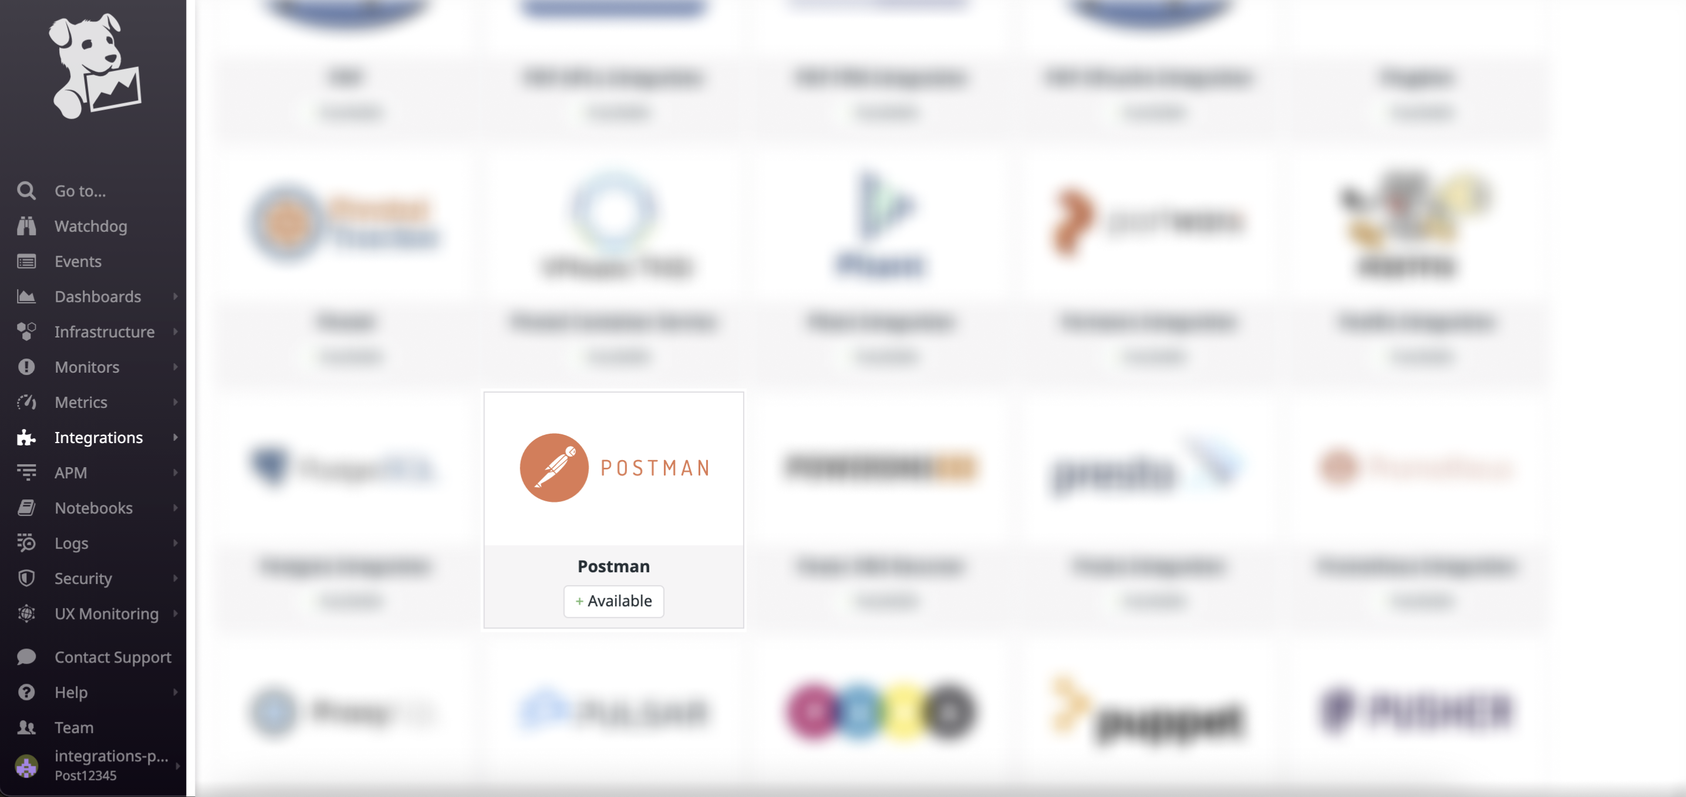
Postman’s analytics integrations allow you to send monitor run results to the tool of your choice for further analysis, and our Datadog integration is one of the most popular ones leveraged by Postman users. (Check out our previous Datadog blog post to see how developers work with this integration in various common use cases.) While Postman has had an integration with Datadog for a while, we have become an official Datadog Technology Partner. This means the integration is now also accessible directly on the Datadog platform that hosts more than 450 built-in integrations.
Postman metrics are now free on Datadog
Until today, metrics from Postman’s integration were “custom metrics,” which meant you were only allowed a limited amount, and extra usage was charged according to your Datadog plan. With the latest release of this integration, you have access to unlimited metrics on the Datadog platform. Also, Postman metrics now follow the standard naming convention followed by other data sources (postman.monitor.<metric-name>), bringing them in line with everything else you track on your Datadog account.
Default dashboard
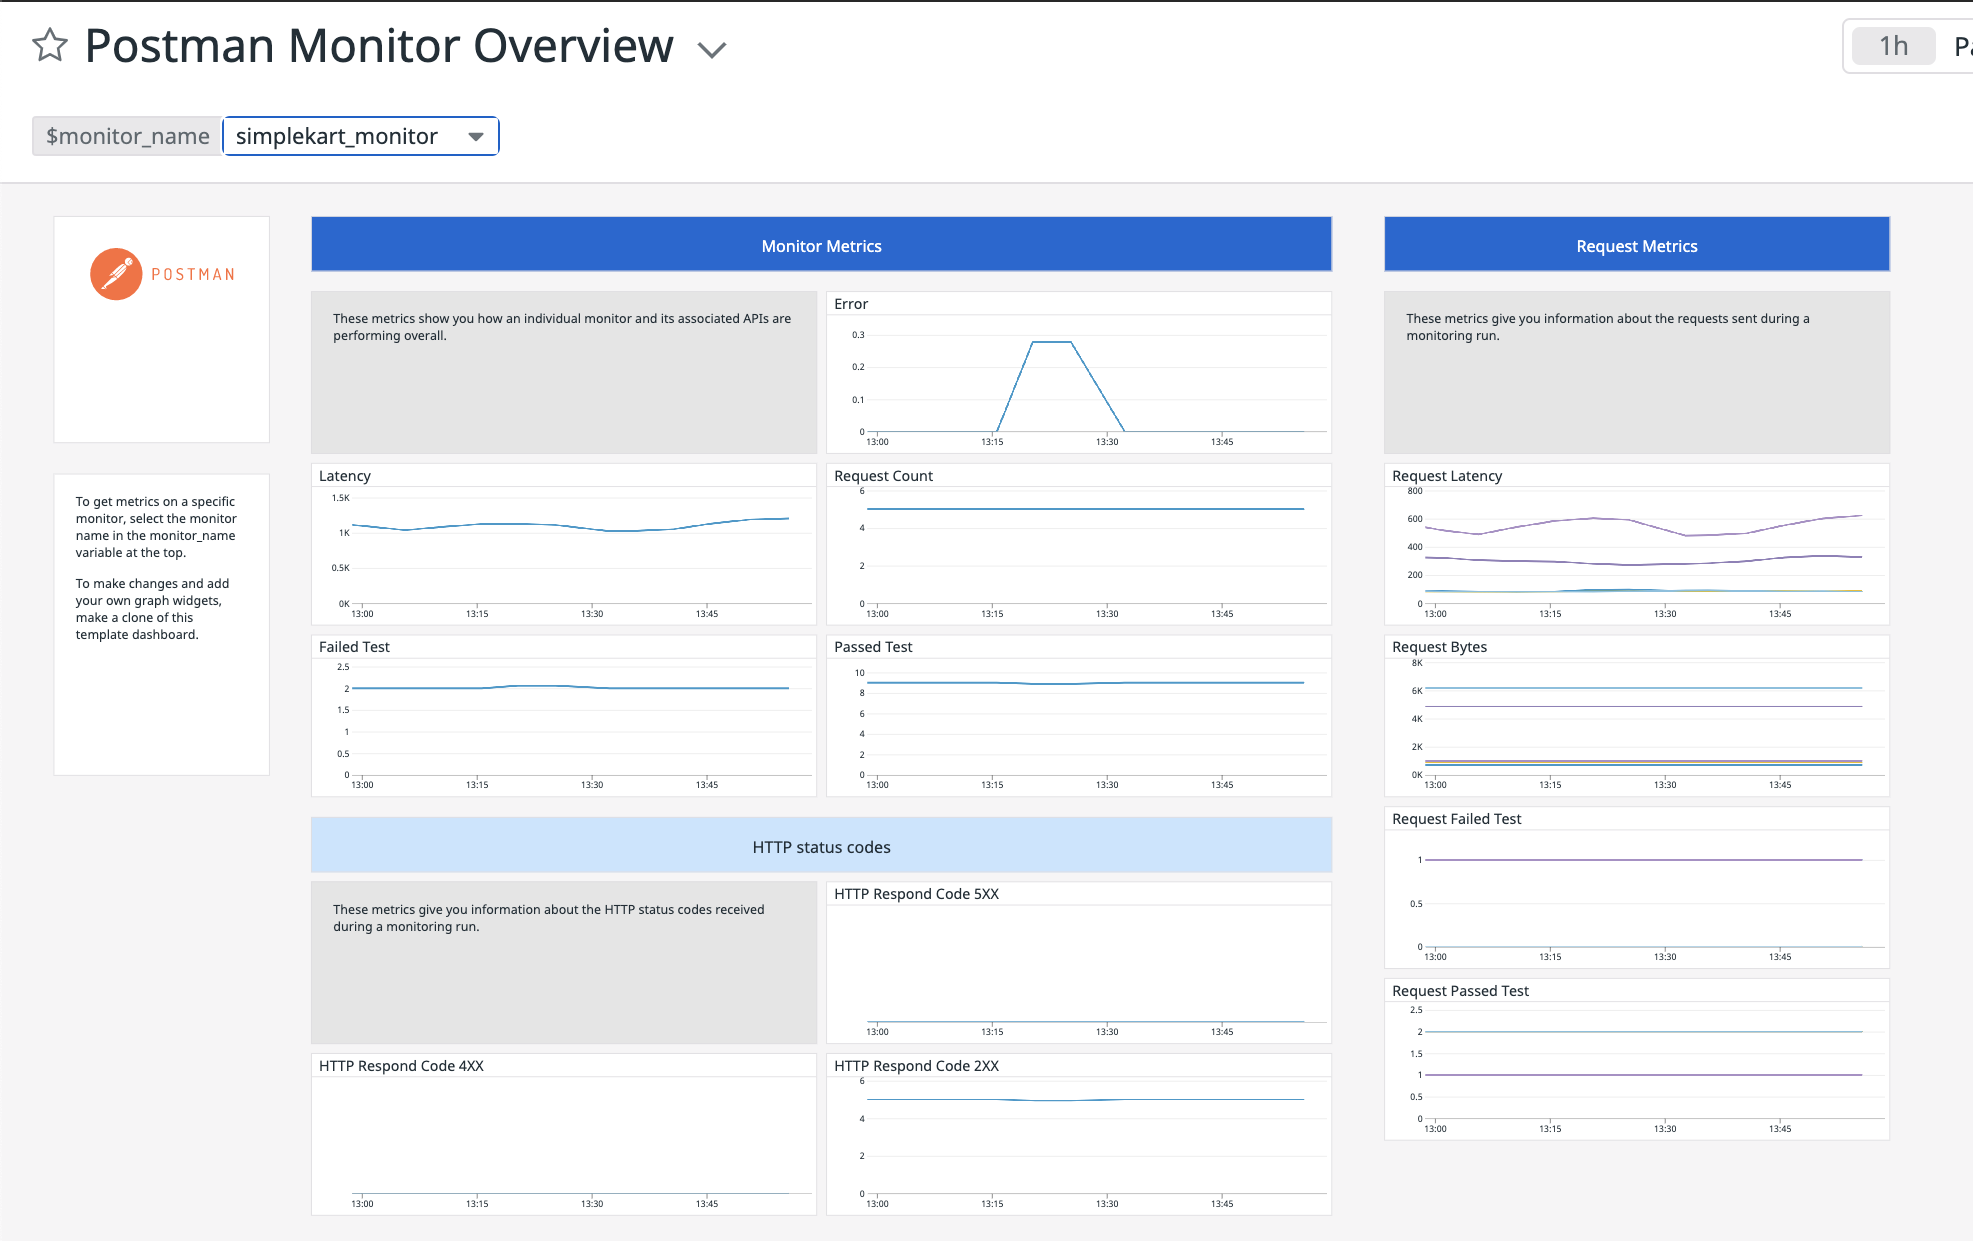
With the integration listed on Datadog, you now get a default dashboard that can be used to observe your APIs. Once you install the integration, the “Postman Monitor Overview“ dashboard will be listed under the “Dashboard List” in Datadog. Just change the monitor_name variable at the top of the dashboard to drill down to the exact monitor that you want to observe.
What does it mean for existing users?
With the latest release, we have changed the names of our metrics to adhere to standard industry practices. While any existing integrations will keep showing the metrics with the older names, new integrations will emit new metric names. Once you switch to the new integration version, you’ll see these metrics in the convenient default dashboard.
Follow our Postman Learning Center documentation steps to upgrade to the new version of the Datadog integration today.


What do you think about this feature? Tell us in a comment below. You can also give product feedback through our Community forum or GitHub repository.