
How we reduced our DocumentDB cost by nearly 50% and optimized performance
Postman’s activity feed plays a crucial role in our users’ development workflows by allowing them to remain informed about changes made in a workspace over time. It is crafted with real-time updates and a resilient, scalable infrastructure, and it serves as the engine behind effortless API collaboration. The scale at which this system runs has been massive since day one, which is why we decided to re-work the architecture and introduce Chronicle. You can read more about this change in our blog post.
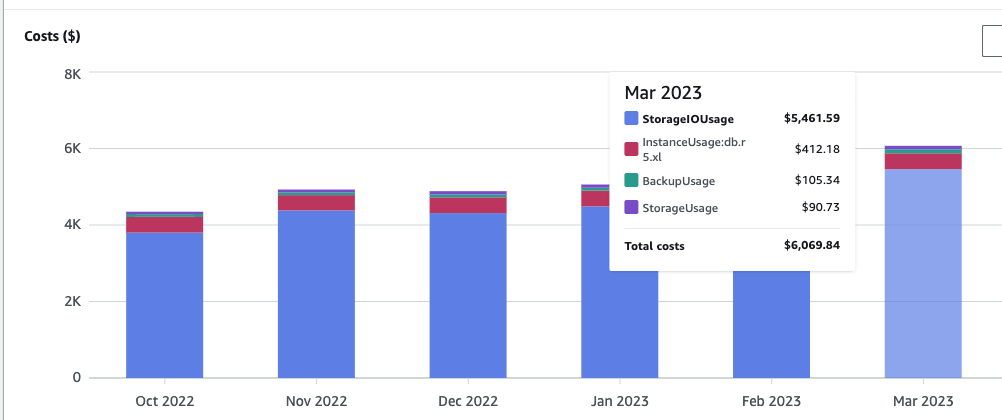
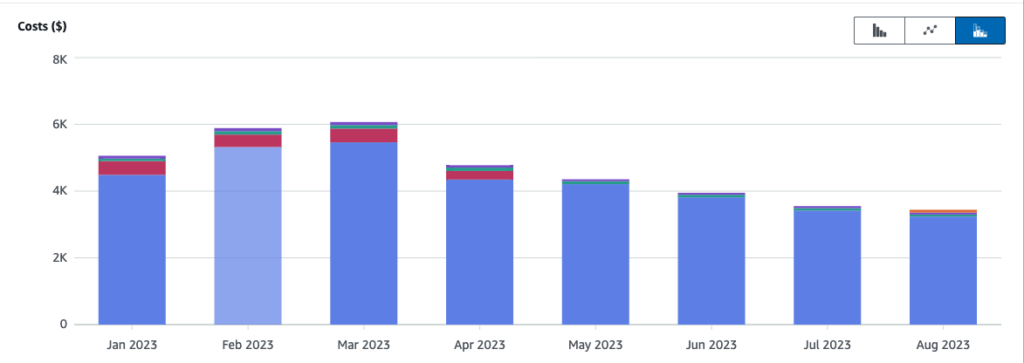
Postman’s activity feed uses DocumentDB for hot storage and MySQL and S3 for cold storage. In February 2023—a few months after we launched Chronicle—we noticed that our DocumentDB costs had shot up and reached more than $6,000 USD per month. We decided to take a deeper look at what was happening in order to understand the cause of this issue and identify opportunities for optimization.
Pricing and infrastructure before optimizations
Capacity and pricing
At the time we noticed an increase in our DocumentDB costs, we were running two r6g.2xlarge instances and one r6g.xlarge instance as the replica, each of which had a cost of $1.0526 and $0.5263 respectively. We were also running a storage rate of $0.10 per GB per month, an I/O rate of $0.20 per million requests, and a backup storage rate of $0.021 per GB per month.
Check out AWS’s documentation to learn more about the pricing model for DocumentDB.
Infrastructure
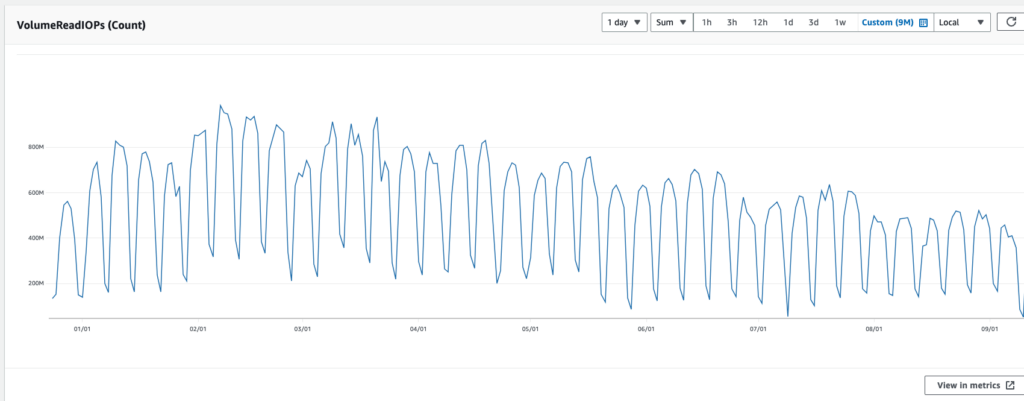
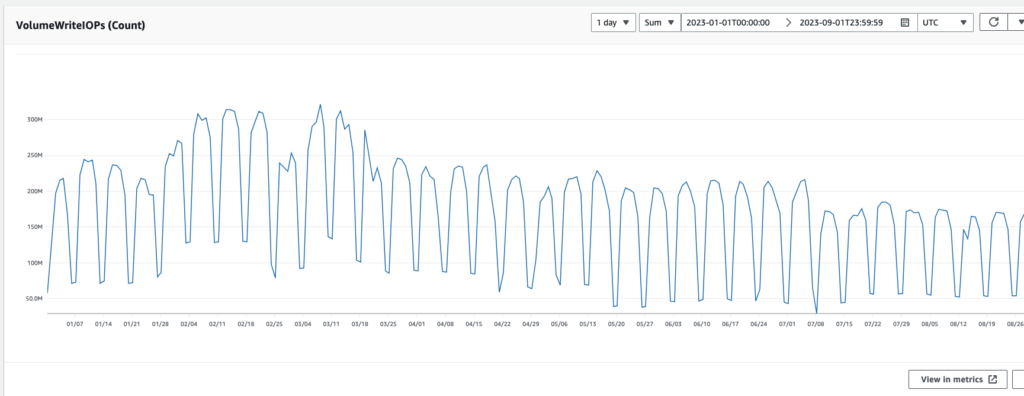
As we began our investigation, we were clocking our VolumeReadIOPs at 950–990 million per day, while our VolumeWriteIOPs were at 300–350 million per day. Based on traffic patterns, we estimated that our VolumeWriteIOPs were therefore almost twice what they should be, and our VolumeReadIOPs were almost three times what they should be.
We then went back and looked at our cost metrics, and we realized that 91% of our cost was coming from I/O. Our month-over-month cost looked something like this, so we knew that I/O was the first thing we should look into:
The Chronicle system
Before we jump into the various optimizations we made, let’s take a look at a few critical components of Chronicle.
Ingestion
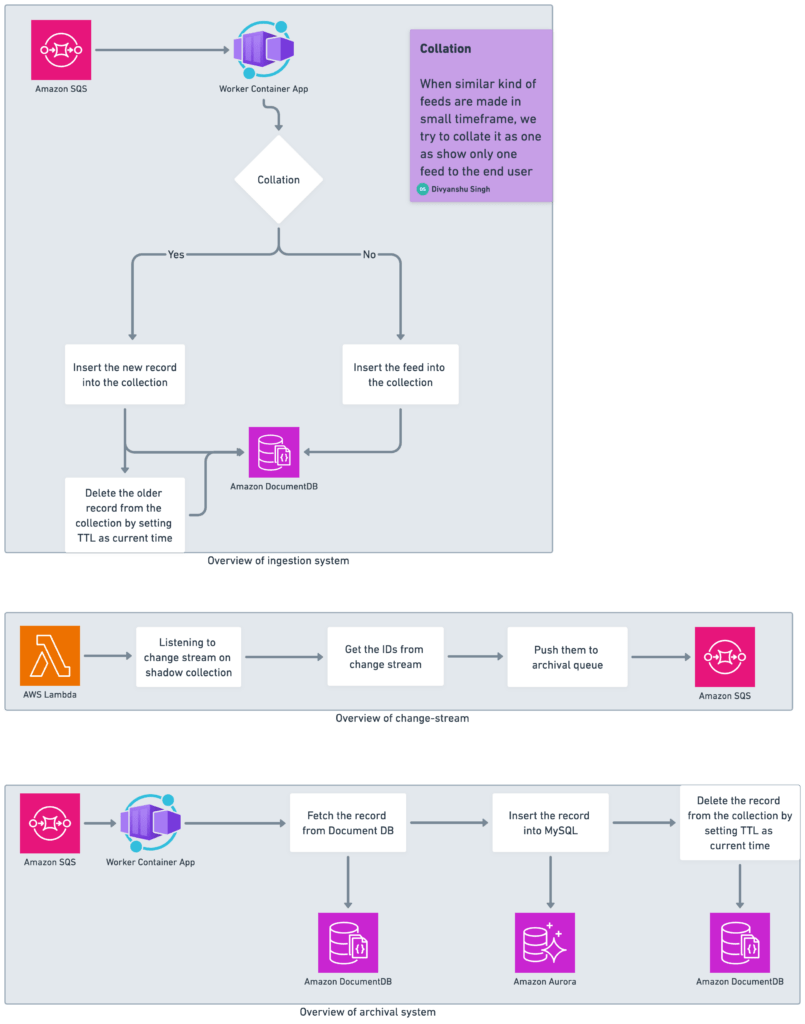
The ingestion system processes, validates, performs collation if applicable (more on that in a moment), and ingests the incoming feed event in the DocumentDB cluster.
Collation
Bursts of changes to Postman Collections and requests that are made in a short span of time are grouped into a single activity feed event in order to provide more meaningful information to the user and avoid bloat.
Shadow collection
Before we made our optimizations, we kept a reference of the actual feed collection in a shadow collection to maintain data consistency. This also helped us ensure data was always available at rest in some data store, as the archival process was based on shadow collection document expiry.
Archival
We actively archive older entries and push them to our MySQL-based semi-cold storage system, which is logically sharded. The data to the archival queue was seeded through shadow collection document expiry using change-stream capability.
Incremental changes to the Chronicle system
We made the following changes to the Chronicle system over the course of several months.
Optimizing the collation query
The feed collation logic runs based on the user, the element on which the action was taken, and the type of action performed. This initially involved a set of rules that would find the most recent entry by sorting on the lastUpdatedAt field, which was not an indexed field. While reviewing our performance insights, we realized this query could be optimized based on our current set of indexes and the _id field could be used. This optimization helped us prevent our IndexBufferCacheHitRatio from dipping and improved our VolumeReadIOPs, as less data had to be brought from the disk and was instead found in the index buffer. It was an important optimization since 80% of our ingested events are collated in feeds.
Note: The BufferCacheHitRatio (BCHR) is the percentage of requests that are served by the buffer cache. A high BCHR means that the buffer cache is efficiently caching the data pages in memory. This results in a relatively low number of reads from disk and prevents a memory bottleneck from forming.
Removing the shadow collection and stopping the change stream
We made four changes that ultimately resulted in the removal of the shadow collection and the cessation of the change stream on the primary cluster:
1. Stopping the change stream on the shadow collection
When reviewing performance insights for the primary instance, we saw that 60% of our queries were coming from the change stream that was running on the shadow collection on the primary cluster. This insight helped us decide to change our archival strategy. Instead of relying on the change stream and shadow documents, we started peeking the oldest 1,000 entries from our feed collection. We now send the IDs of these documents to the archival queue to be processed and archived.
Note: The change streams feature in Amazon DocumentDB (with MongoDB compatibility) provides a time-ordered sequence of change events that occur within your cluster’s collections. You can read events from a change stream to implement many different use cases
Applications can use change streams to subscribe to data changes on individual collections. Change streams events are ordered as they occur on the cluster and are stored for three hours (by default) after the event has been recorded.
2. Stopping ingestion and archival on the shadow collection
After adjusting the change stream system so that it no longer relies on shadow collections, we also realized we don’t need to ingest any data on this collection. This new approach saves up both inserts and updates (for collation).
We deleted these records on the archival layer by setting the time-to-live (TTL) once they were inserted in our semi-cold storage. This brought our write query count down to 50% and led to a significant decrease in VolumeWriteIOPs. We assumed that deleting these records through TTLs would further optimize them because they would run in the background, leading to improved database health. We later realized that this assumption was wrong and we had to change our approach.
3. Dropping the shadow collection
After making the change at the ingestion layer to stop any action on the shadow collection, we decided we could clean this space on the cluster and drop the collection entirely. The total amount of space being used by this collection was around 400 GB, along with indexes, which accounted for almost 40% of our total used storage space.
In earlier steps, we made sure to confirm that our application would not be using this collection and that it was safe to drop it. We also had a meeting with the AWS support team to understand the impact this change could have on the cluster. We wanted to be cautious of performance regressions on our production database, and we completed this change without any downtime.
4. Stopping the change stream on the cluster
We finally turned off the change stream on our primary cluster, which helped us save some background I/Os.
Fixing our current set of indexes
While these other changes were in progress, we were constantly in touch with AWS support engineers and DocumentDB architects, as we kept seeing our index buffer crash and come back after a while.
Our initial assumption about how these indexes worked was that when we tried to sort on an index that was already created as primary, it would combine it with the where clause compound index being used and optimize the query planner. As we audited our queries, we realized that this does not seem to happen, and the sort field needs to be present as a suffix, along with the where clause compound index.
The audit process also helped us come to the conclusion that we could improve our indexes to better support the read traffic pattern. We made this change and dropped a few earlier unused indexes, which led to a significant improvement in our IndexBufferCacheHitRatio. This also reduced the number of seeks into the disk, further saving I/Os.
Moving from TTL-based deletes to normal deletes
The Chronicle system had deletions in two places:
-
Archival system: This is where we kept deleting the entry from our hot DocumentDB data storage and moving it to semi-cold MySQL storage. We were setting the expiryAt value to the current time, and the field has a TTL index on it, which deletes these entries in the background.
-
Ingestion system: During the collation process, we were inserting the new record and deleting the older similar record that was present. We took this approach to avoid the complexity of maintaining two cursors while the pagination of these feeds came into play, and the
ObjectId(_id)always sorts records. The deletions here were also updating theexpiryAtfield to the current time so that it could be picked to be deleted in the background.
We realized that, while we were trying to optimize database health by setting TTL and letting deletes run in the background, this approach resulted in high I/Os.
DocumentDB follows MVCC (Multi-Version Concurrency Control), which makes sure that a newer version is made during updates and an older version is cleared in the background. This meant that we were paying I/O costs for updates, MVCC background cleanup, and deletes happening in the background.
We decided we would change all of these TTL-based deletes to direct deletes to gain additional I/O improvements.
Note: Multi-Version Concurrency Control (MVCC) is a mechanism that prevents inconsistent data from being viewed when concurrent transactions update the same rows. MVCC provides strong transaction isolation for each database session and minimizes lock-contention in multi-user environments.
MVCC works by creating several versions of a single database record. This allows various transactions to access different versions of one database record without conflicting with one another.
Dropping TTL-based indexes
Once we moved to normal deletes from TTL-based deletes, we were also able to clean up the TTL index that was present on the expiryAt field. This allows us to continuously scan the documents in the background to see if any document is eligible for deletion. There is a TTL monitor that continuously runs on the cluster to identify such documents.
Note: TTL indexes are special single-field indexes that can be used to automatically remove documents from a collection after a certain amount of time. TTL indexes are implemented as a special index type in MongoDB.
In MongoDB, a background thread reads the values in the index and removes expired documents from the collection. This usually happens every minute.
Updating the collation strategy
Next, we decided to change our collation strategy from insert and deletes to updates.
As mentioned earlier, approximately 80% of our ingestion traffic results in collation. This involves inserting and deleting a record every time collation happens. We decided we could take the trade-off of maintaining two cursors and converting inserts and deletes to updates with little change in indexes. This also reduced I/Os on our primary cluster, which helped us improve performance and reduce costs.
Results and wins
These optimizations led to several improvements at the cluster and instance levels:
I/O
Cluster metrics:
-
VolumeReadIOPs: We reduced the number of read I/O operations from 980 million a day to 500 million a day:
-
VolumeWriteIOPs:We reduced the number of write I/O operations from 315 million a day to 170 million a day:
Performance
Cluster metrics:
-
CPU: We reduced the CPU utilization of the overall cluster by 35%.
-
IndexBufferCacheHitRatio: We increased the IndexBufferCacheHitRatio of the overall cluster from 94% to 98.9%.
Instance metrics:
-
CPU (writer): We reduced the CPU utilization of the overall instance by approximately 47%.
-
CPU (reader): We reduced the CPU utilization of the overall instance by approximately 35%.
-
IndexBufferCacheHitRatio (reader): We increased the IndexBufferCacheHitRatio of the overall instance from 89% to 98.7%.
Cost
These improvements resulted in cost reduction at various places:
-
I/Os: We were able to reduce our I/O costs by 40%, which contributed significantly to our overall reduction in the cost of running our system.
-
Instance usage: With all the performance gains we got, we were able to remove the extra replicas we were running on this system.
-
Backup and storage costs decreased as a result of these improvements.
We saw a 49% reduction in overall costs from the peak. This was a significant win for us, given the months of incremental improvements on the Chronicle system:
Next steps
We are still identifying things we’d like to do in order to further optimize the Chronicle system. For instance, we’d like to understand the cause behind the high VolumeReadIOPs on the primary cluster. We have dramatically reduced our VolumeReadIOPs, but as we continue to review our traffic patterns, this number still seems significant. So, we are trying to figure out what might be contributing to high I/O spikes.


What do you think about this topic? Tell us in a comment below.