
How to Identify Actionable Metrics vs. Vanity Metrics
As technology has advanced over the past two decades, more organizations have come to realize the importance of data in driving well-informed decisions. Gartner predicts that “by 2022, 90% of corporate strategies will explicitly mention information as a critical enterprise asset and analytics as an essential competency.” To meet this growing demand for analysis-as-a-skill, there are many learning resources teaching people how to leverage data. In fact, Postman has features that enable users to visualize API responses and conduct API reporting. Most resources—blogs, articles, courses, and more—help people answer the question of “How do I analyze?”
But as a consumer of data, the key question we should be asking ourselves is “What should I analyze and why?”
In his recent book, Web Analytics 2.0, author Avinash Kaushik says, “We have evolved from measuring (website) hits in the early ’90s to page views to page visits. Today, we seem to be moving to using actionable metrics (also known as outcome-based metrics) as a true measure of health and success.”
In this blog post, I’ll show how to identify actionable metrics and also how they can be useful beyond web analytics.
Defining your problem
Before jumping into the analysis part, you first have to construct the problem statement and understand the “why” of the given problem. This involves asking the right questions to identify any constraints and establishing desired outcomes. Doing this exercise almost always points you toward the probable answers and also helps you understand exactly what data trends you want to capture.
Identifying what matters (actionable metrics) vs. what doesn’t (vanity metrics)
Actionable metrics lead to definitive and consistent actions that can be tied to the goals of the business. Vanity metrics, on the other hand, may appear to be related to our actions, but they don’t enable us to identify or quantify the impact of our actions in any way. Let’s have a look at how you can identify what truly matters, actionable metrics:
- Capturing the right data: Understanding what you are capturing and identifying the sources of input for the data is crucial in confirming the accuracy of the metric. Data is only as reliable as its source, and a lot of times we get data from external sources. So, it’s important to use input sources whose data-logging mechanisms are fairly transparent and consistent.
- Identifying the actionable data: In real-world scenarios, we are exposed to a lot of data (in many cases, more than what we can make sense of). Whenever you define a metric that will require data, you should try to ask yourself: What decisions can I make upon understanding this metric? Does the metric help me quantify the impact of our actions? If the metric does not empower you to act (or react) on the numbers you see, it probably isn’t worth capturing in the given context.
- Reproducing the results: When you capture the right metric, it not only helps drive tangible actions (based on the numbers it represents), but the actions in turn also affect the value of this metric. To illustrate this better, let us consider that with no change in the definition of the metric, we see a spike (or dip) in its numbers. Now, if our actions can somehow impact the numbers of the metric—to reproduce the spike (or avoid the dip)—then the metric is considered actionable. That means the reproducibility of results is an important indicator of an actionable metric; non-reproducibility indicates randomness in numbers that makes the metric non-actionable (i.e., a vanity metric).
Vanity metrics scope of actionability: Even though vanity metrics don’t enable us to make any decisions related to the problem based on their numbers, they are still helpful in steering us in the right direction. Vanity metrics show us that we need to continue capturing better and more actionable metrics.
Example of solving a real-world problem
Let’s say you want to measure the performance of your product by observing consumer behavior, and then use these observations to come up with ways to improve the customer experience. It helps to evaluate a few metrics that are commonly used in this context and figure out if they are actionable. Let’s assume you want to track the following numbers month over month:
- Number of downloads: As the name suggests, this metric measures the number of downloads of the product. This number is often used to measure a product’s popularity (as a measure of its performance). However, it acts only as a pseudo-indicator, because it does not even reflect the number of unique users of the product. So this metric by itself does not relate to a business goal, making it hard to quantify the impact of actions on its numbers. Hence, this is a typical example of a vanity metric.
- Number of active users: Any person who actually shows up on your product (as opposed to just downloading and forgetting about it) is considered an “active user.” This is an actionable metric in a lot of cases because this directly relates to users that can be targeted (and are affected) by business decisions. Therefore, an increase in the number represented by this metric implies improvement of the product, while a decrease implies or deterioration.
- Number of activated users: In reference to the given problem, the active users metric does not give us any idea about whether or not the users are deriving value from the product. That’s where the number of “activated users” comes in. Users are considered activated when they have performed a set of meaningful actions on the product (what is identified as meaningful is based completely on the business context). When your use case is to understand and improve the user experience, measuring the activated users is an important actionable metric.
- Number of retained users: Through the “retained users” metric, you can go one step further and try to identify activated users who continue to derive value from your product. You can assume that users continuously derive value if they regularly use the product to solve their needs; this metric is best visualized in relation to time frames (i.e., with respect to the month they first got activated). This information helps you quantify and annotate the impact of product evolution to user behavior. This makes it an actionable metric.
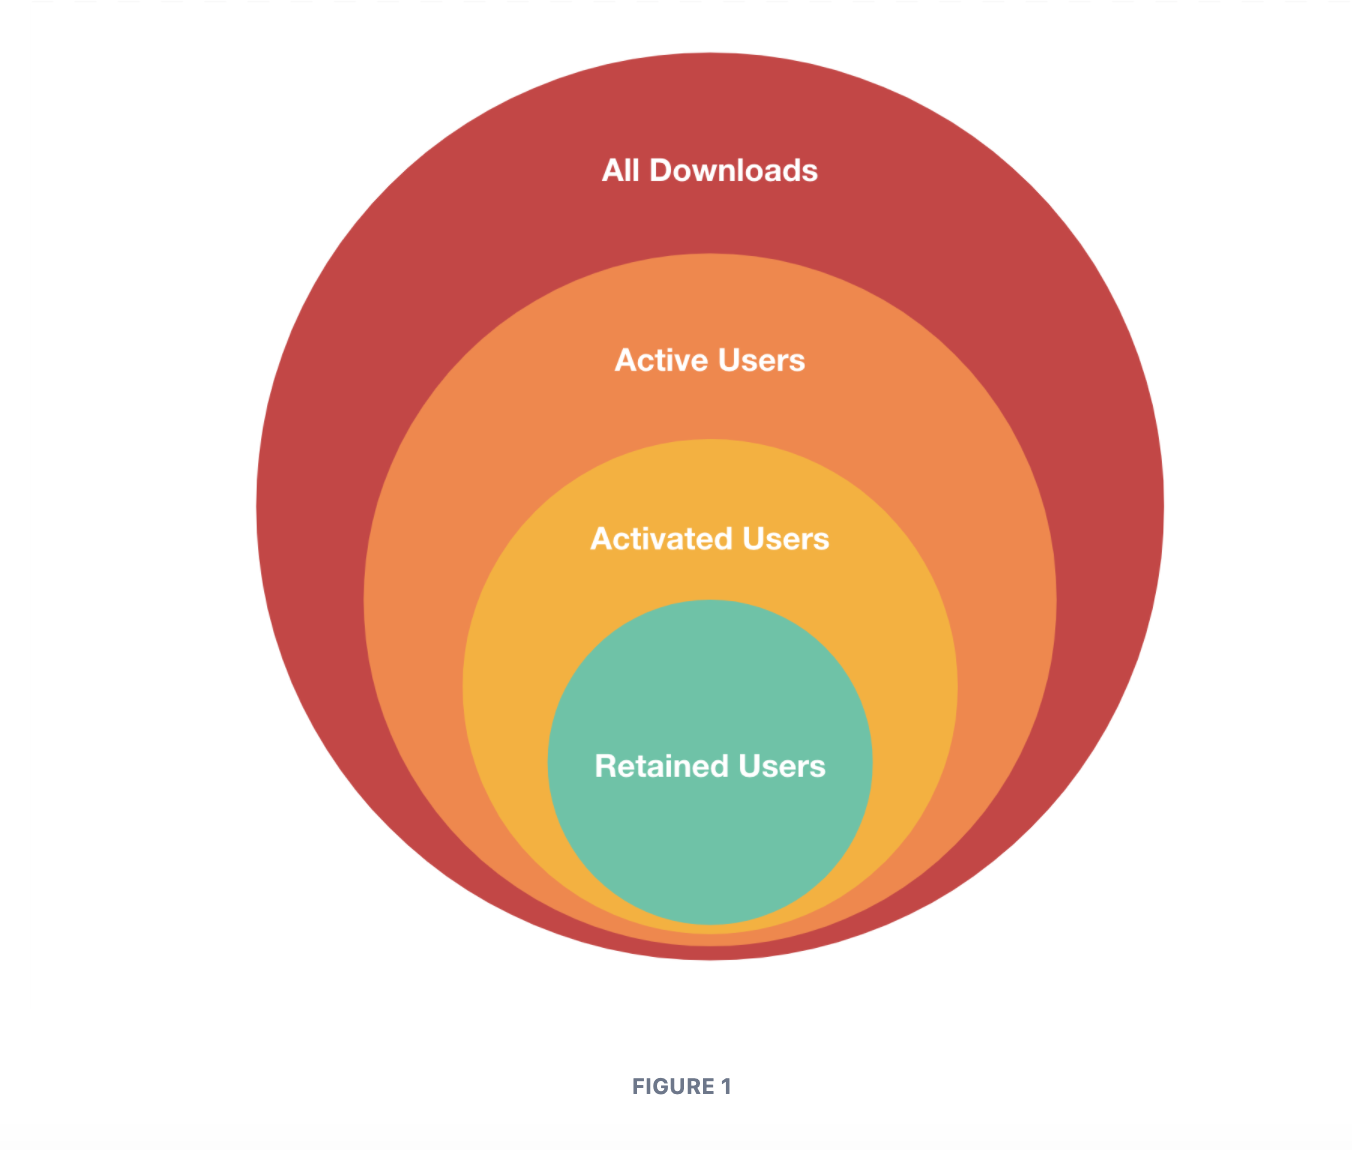
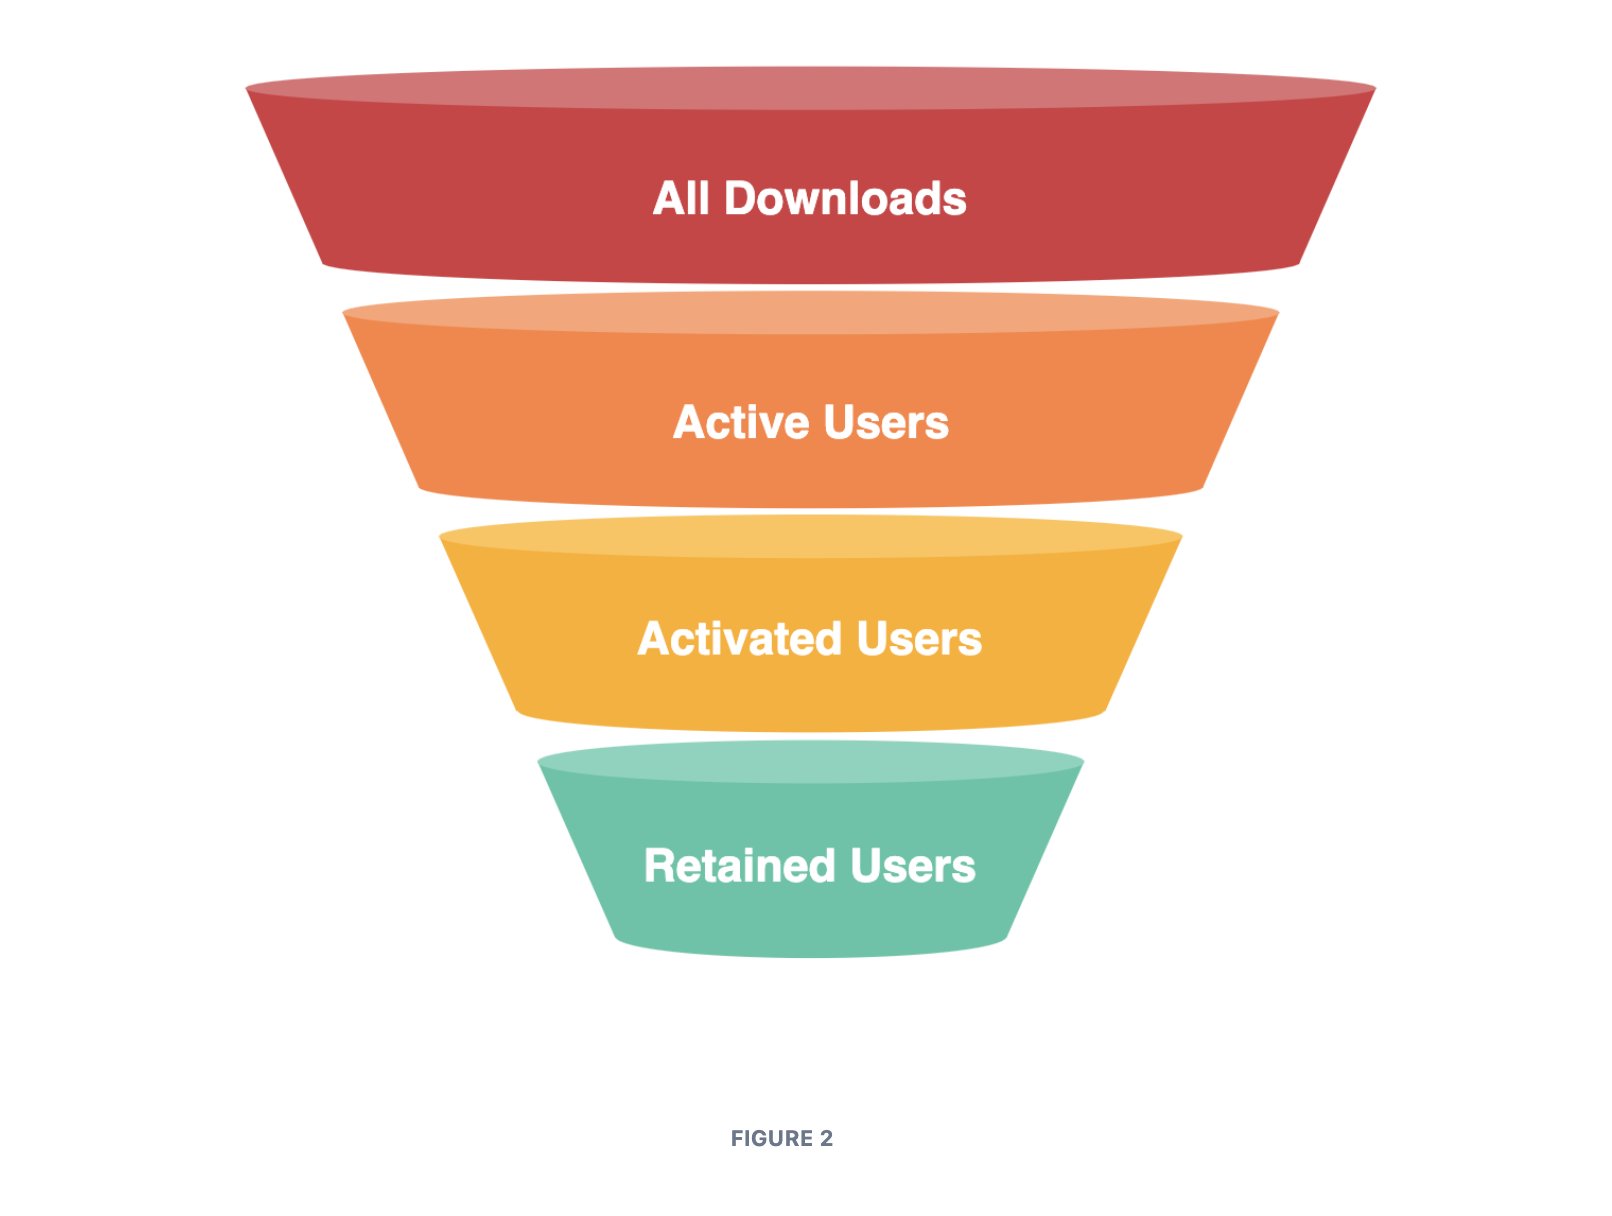
- Conjunction of metrics: Even though some of the metrics listed above are vanity metrics when viewed individually, when shown in conjunction, we see the dropoff (or conversion) rates between each stage. When viewed together, they are highly actionable. Whereas Figure 1 is just a top view of the user retention funnel, Figure 2 shows a conjunction of metrics as a funnel analysis:
Identifying the action steps
An analysis is only complete when it informs well-defined action steps to help a business reach its goals. Here are a few generic goals that you can achieve from solving the above real-world problem with actionable metrics:
- Attract new users: The number of active users is a good indicator of your ability to acquire new users to your product. If this number is low, the logical action would be to make the product more intuitive to use and question/identify whether you are acquiring the right users.
- Improve usage of product: The number of activated users enables you to identify usage behavior by looking at what makes users activated in the first place. A small difference between the number of active and activated users points toward improvement in usage, leading to desirable, productive user behavior.
- Improve user experience/flows: This can be measured by understanding drop-off (or conversion) rates at each stage of the funnel. Intuitive products with well-defined user flows make it easier for consumers to derive value and stay retained.
Conclusion
At the end of the day, identifying actionable metrics for your analyses is key to solving any problem. The best way to identify the right data points—and, ultimately, your solution—is by asking the right question from the start: “What should I analyze and why?”
Did you find this blog post interesting? If so, you might also be interested in working at Postman. Learn about joining the Postman team here.