How-To: Graphing COVID Time Series Data Using Chart.js and Postman Visualizer
In this extraordinary time, people all over the world have been stepping up by collectively sharing and contributing to data in a variety of ways. Here’s just one example that we’ve been involved with: The Postman team has been hard at work creating and updating the crowdsourced COVID-19 API Resource Center to give people easier access to—and, just as importantly, the ability to consume and understand—public data.
Let’s take one COVID-related, community-generated API and build a visualization of the API data so that it’s easier to consume and understand.
Learn to visualize data in Postman
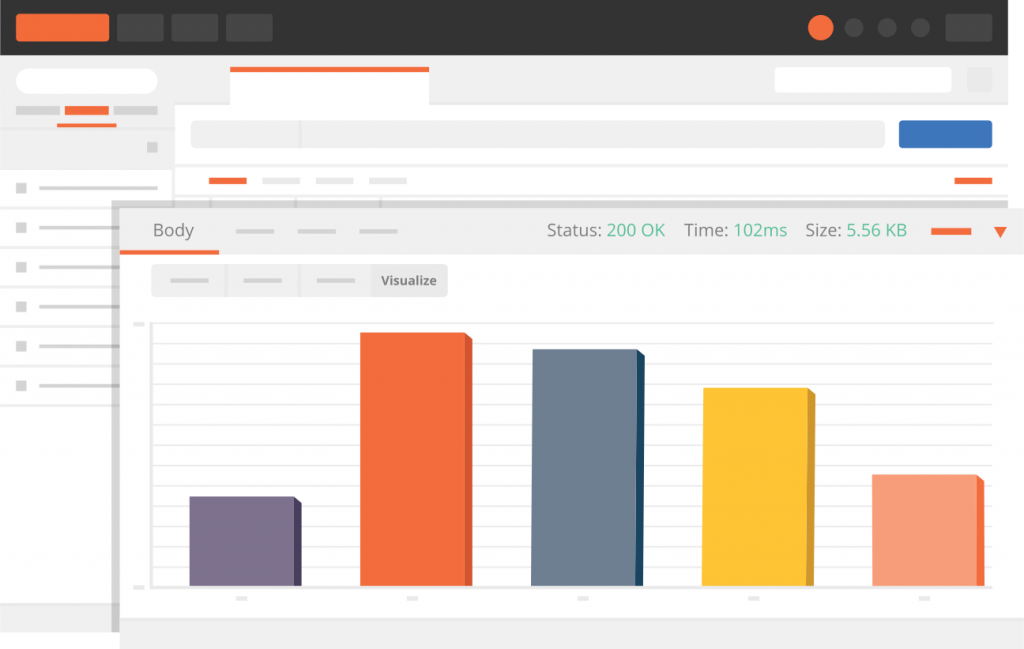
In this tutorial, you’ll learn how to use Postman Visualizer to graph COVID time series data within the Postman app.
To get started, go to the How to visualize data in Postman page, then click the orange Run in Postman button in the upper-right corner of that page to import this example
collection into your Postman app. You can walk through this collection’s step-by-step documentation in the Postman app or on the web.
Step 1: Understand scripts in Postman
Under the Pre-request Script and Tests tabs in the Postman app, you can add JavaScript code before the request is sent and after the response is received, respectively. Postman will run this code in a Postman sandbox environment, which also gives you access to some built-in functions that we’ll explore in a bit. This code that runs before or after your request is called a script in Postman.
- Pre-request Script — before request is sent
- Test Script — after response is received
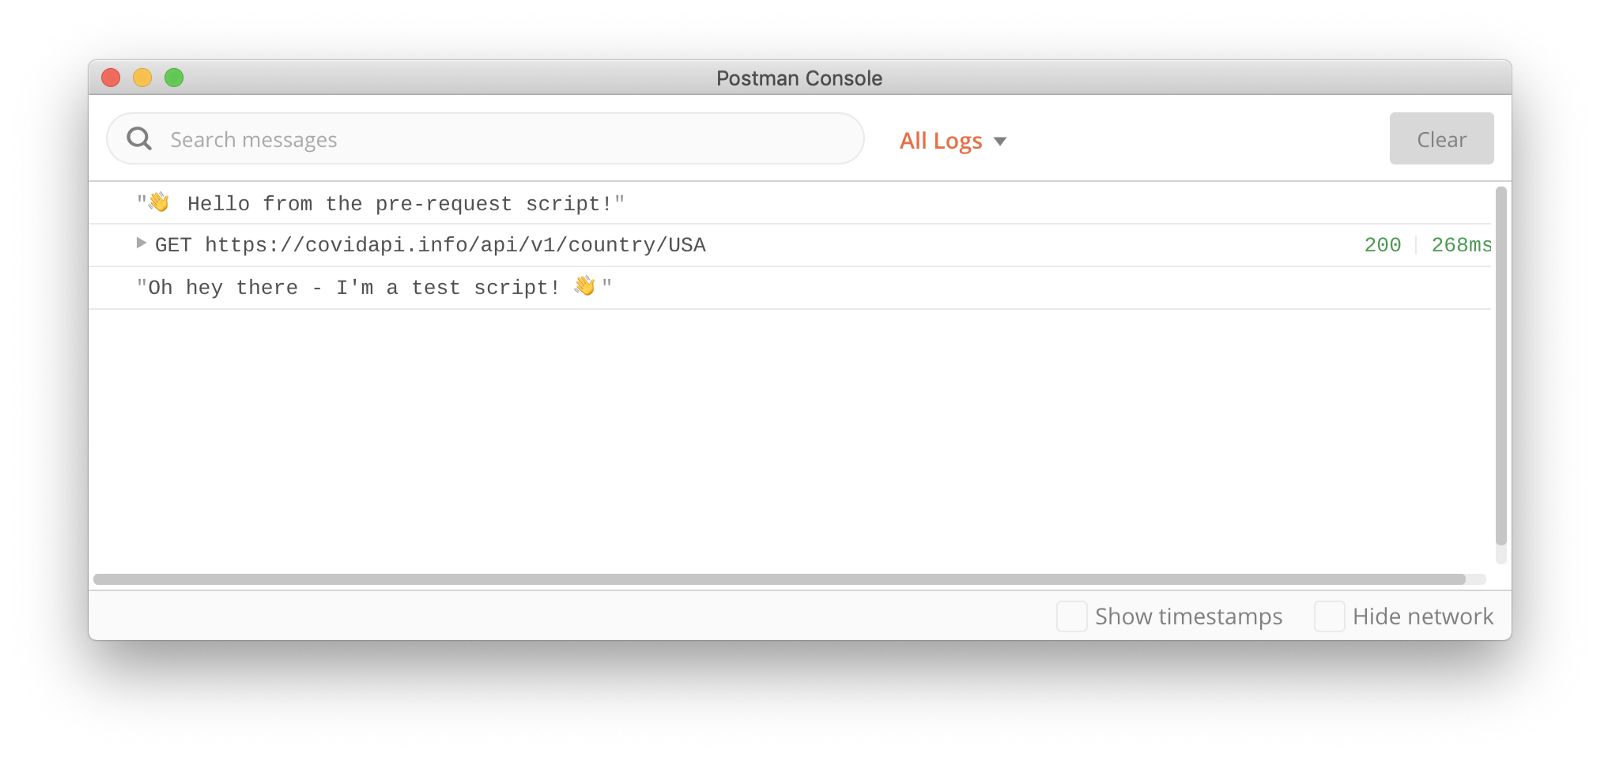
Open the Postman console using the bottom left icon with the hover text “Postman Console.” Send the Step 1 request, and see the execution order of your main network request in relation to the pre-request and test scripts in the console:
Step 2: Add the visualizer code
Under the Tests tab in the app, add this code to set the visualizer:
// Set visualizer

pm.visualizer.set(template, {

  // Pass the response body parsed as JSON as `data`

  response: pm.response.json()

});
The pm object contains a bunch of information and functions related to the script being executed. It’s available in the Postman sandbox that we talked about in the previous step.
In this example, we’re using the pm.visualizer.set() method to apply the visualizer code that we will write in the next step, and then display it in the Visualize tab of our response after we run the request. This method takes three parameters: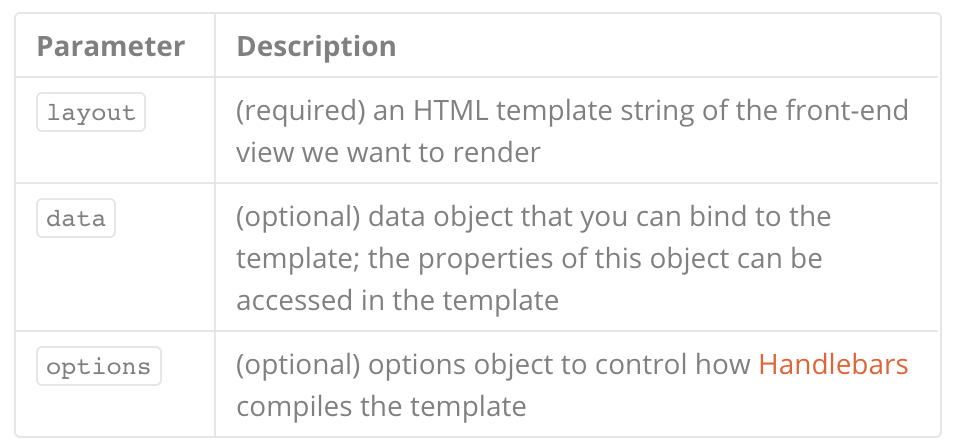
Let’s dig into these parameters in the next steps.
Don’t hit Send yet!
Step 3: Add the layout
Now that we’ve added pm.visualizer.set() under the Tests tab, take a look at the first (and only required) parameter:
layout– (required) an HTML template string of the front-end view we want to render
In our example code, we see a placeholder `template` as the first parameter in pm.visualizer.set(). We haven’t initialized that variable yet. Above this code, add a variable called `template` as an empty string:
let template = ``;

// Set visualizer

pm.visualizer.set(template, {

  // Pass the response body parsed as JSON as `data`

  response: pm.response.json()

});
Inside the template string, add some HTML elements like header, text, or an image.
Hit Send, and take a look at the Visualize tab of our response after we run the request. You should see something like this: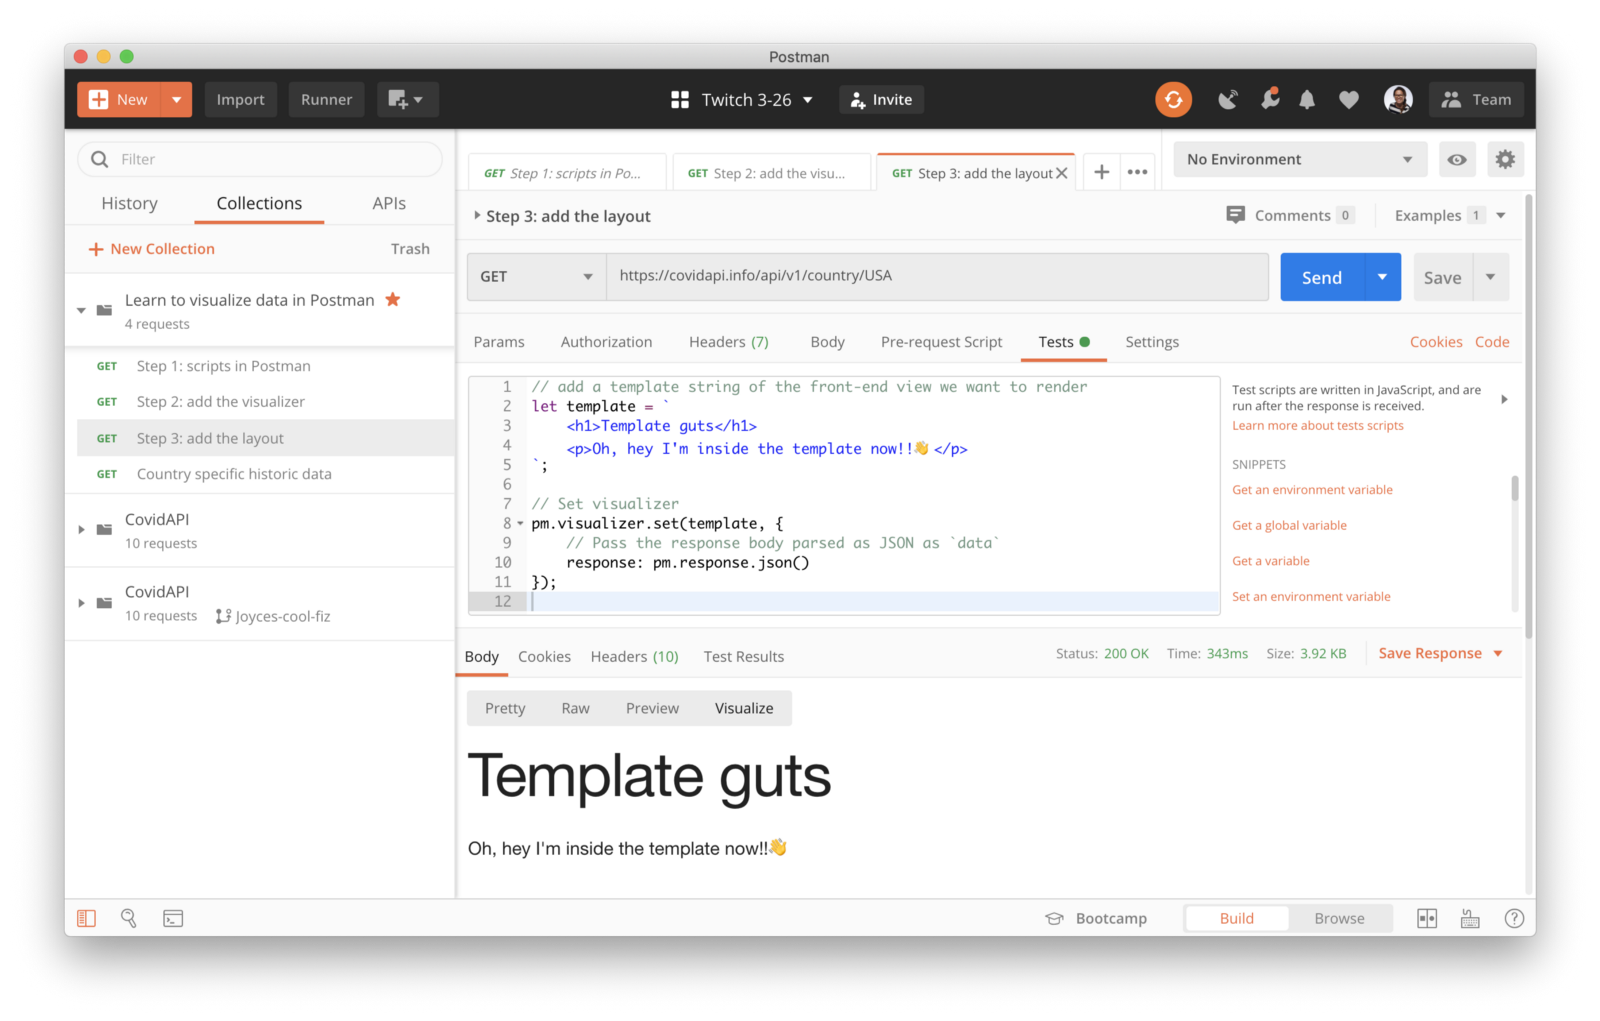
This is good, but we haven’t passed any data to our template yet. Let’s forge ahead!
Step 4: Pass the data
Now that we’ve added pm.visualier.set() and defined an initial layout for our front-end view, let’s take a look at the second parameter:
data– (optional) data object that you can bind to the template; the properties of this object can be accessed in the template
In our example code, we see a placeholder for the second parameter in pm.visualizer.set(). Once again, we are using the pm object in the Postman sandbox. This time, pm.response.json() captures the response returned from the API so we can parse the response body as JSON:
pm.visualizer.set(template, {

  // Pass the response body parsed as JSON as `data`

  response: pm.response.json()

});
In the string template where we define our front-end layout, the Handlebars templating engine is built in to help us render the data returned from our API. Use the double curly braces to wrap a Handlebars expression like {{expression}}.
This is what our data looks like coming back from our API: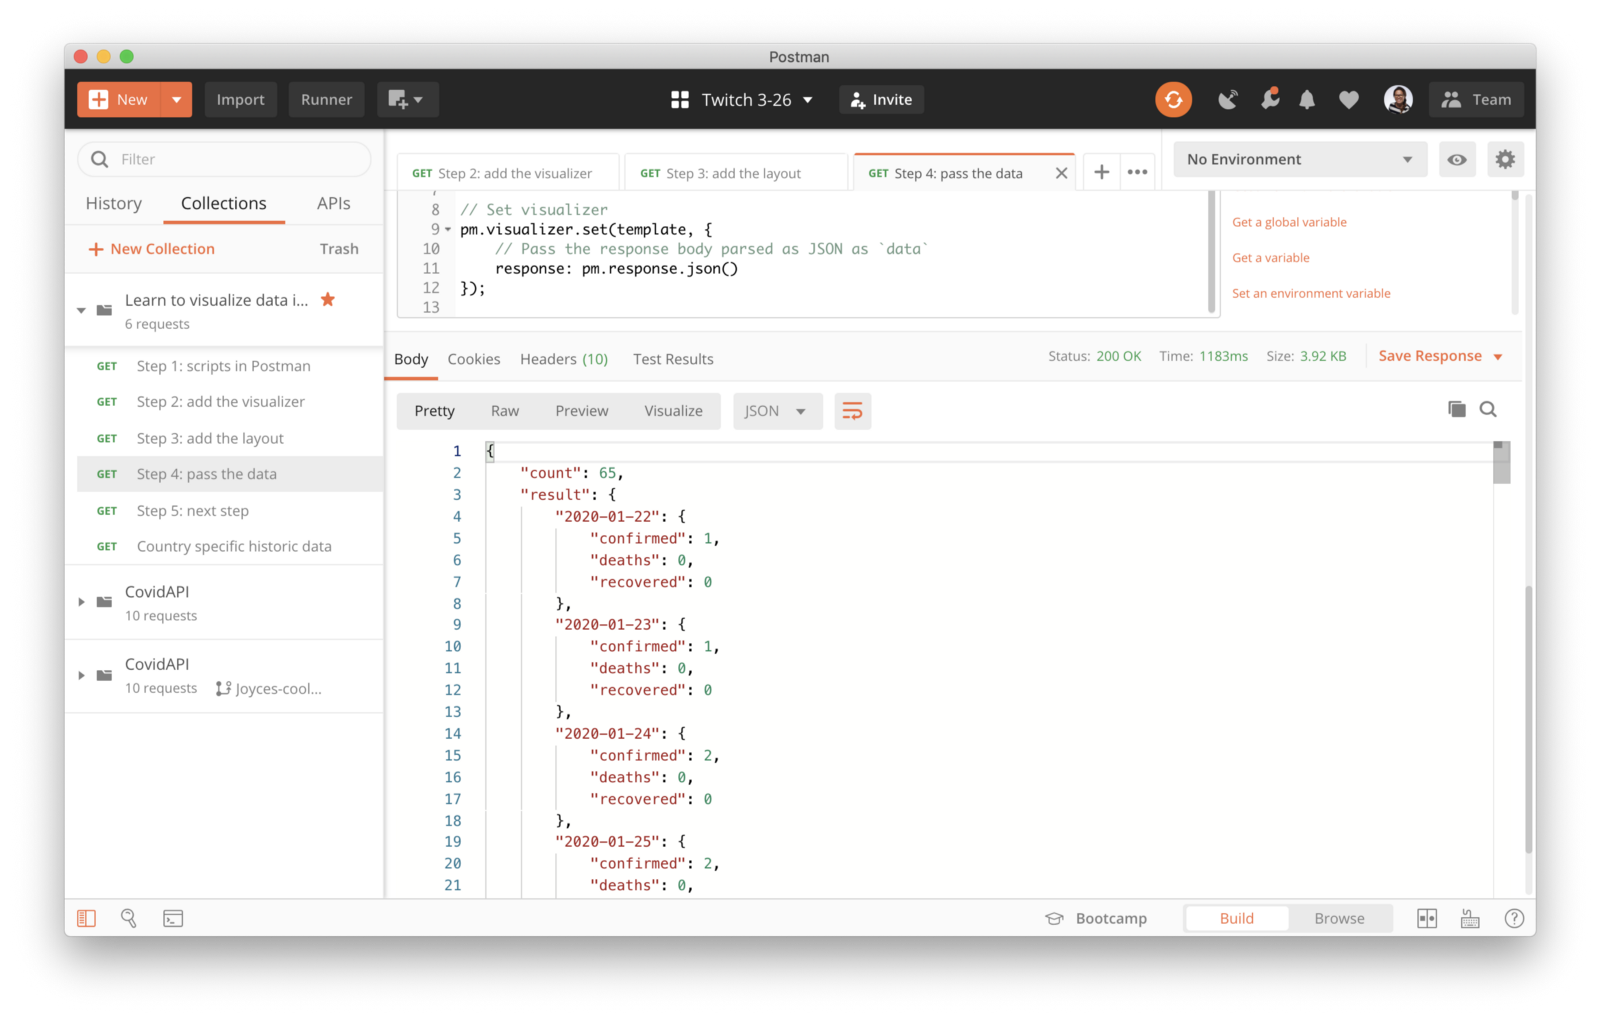
For this example, we’ll use Handlebars each in our template string to loop through each item of the response body. We are looping through response.result because response is the property name we used in pm.visualizer.set() and result is the property name from the response body returned from our API. Use Handlebars {{@key}} to reference the current key name, which will be a date. And then add an HTML line break tag <br> to list each date on a new line:
let template = `

  {{#each response.result}}

    {{@key}} <br>

  {{/each}}

`;
Hit Send, and take a look at the Visualize tab of our response. You should see something like this: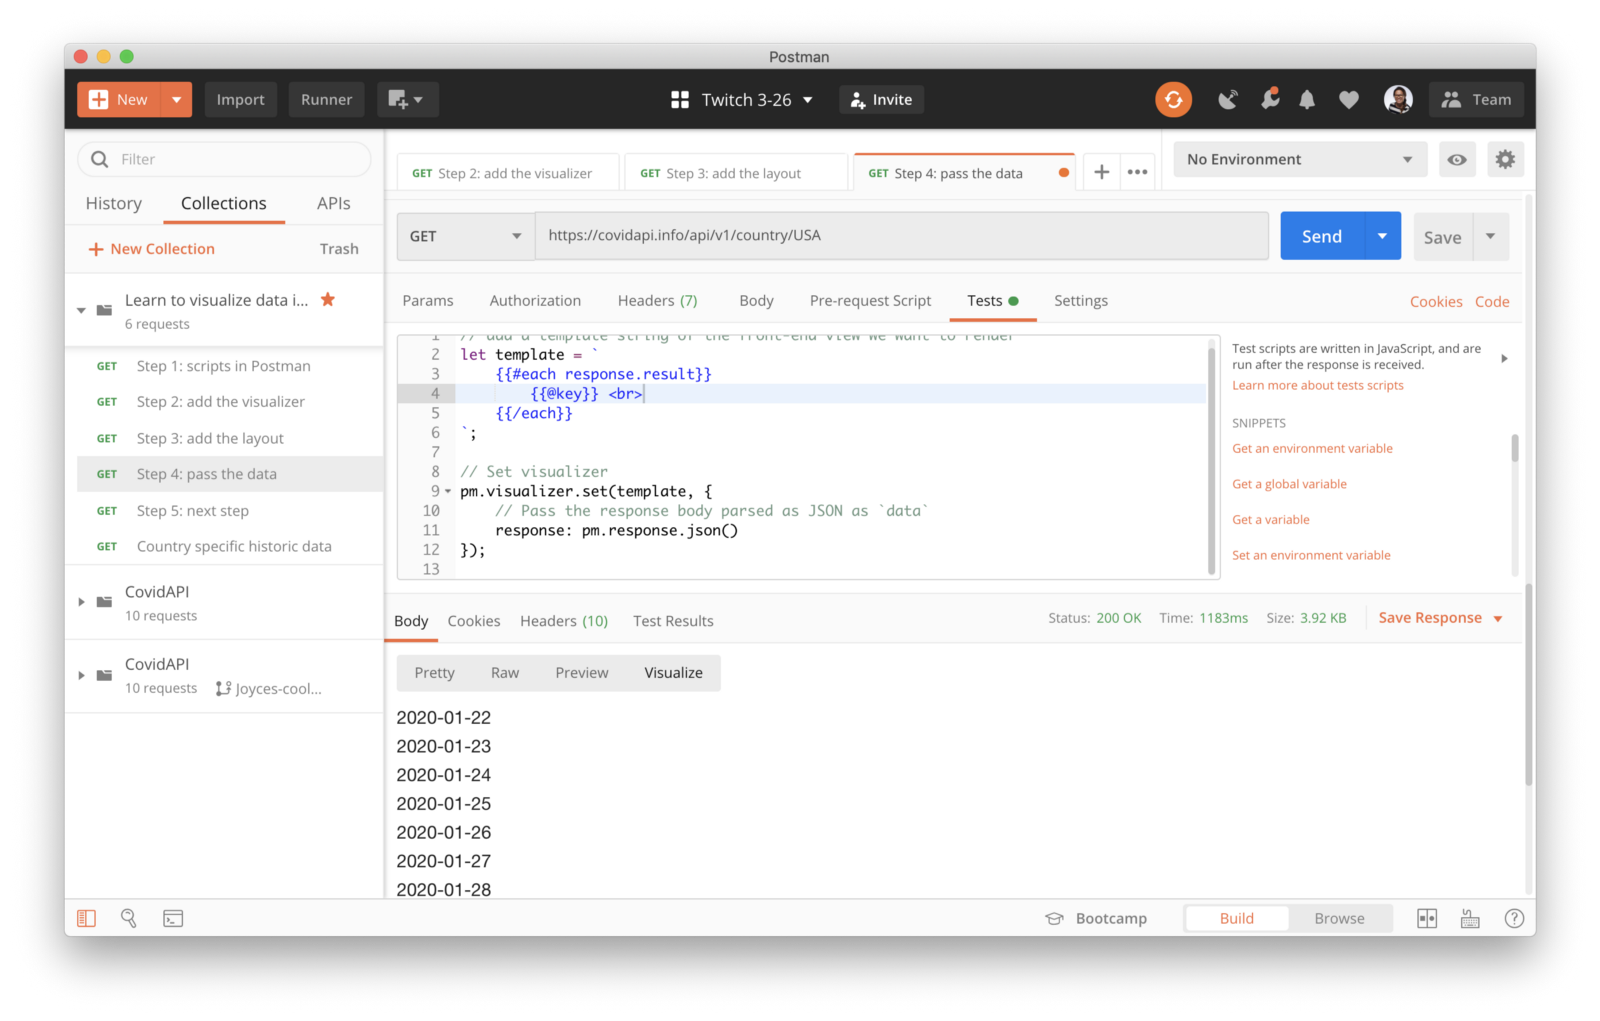
This is progress, but if you’re a front-end developer or designer, you’re probably thinking — oh how ugly! Let’s keep going.
Step 5: Make it pretty
We now have a functioning visualization, but it’s not very pretty and it’s not very useful yet. So far, we’ve added a tiny bit of JavaScript and HTML to our layout template. There are three more steps we could take to really polish it up:
- Add more HTML
- Add CSS using
<style>tags or<link>to external stylesheets from within your template - Add JavaScript interactions or external libraries using
<script>tags inside your template
Let’s go ahead and add some HTML and CSS to our template string. In the example in the screenshot below, I added paragraph tags <p> , and then CSS within <style> tags to style those paragraph elements, and then hit Send. See how our visualization has changed: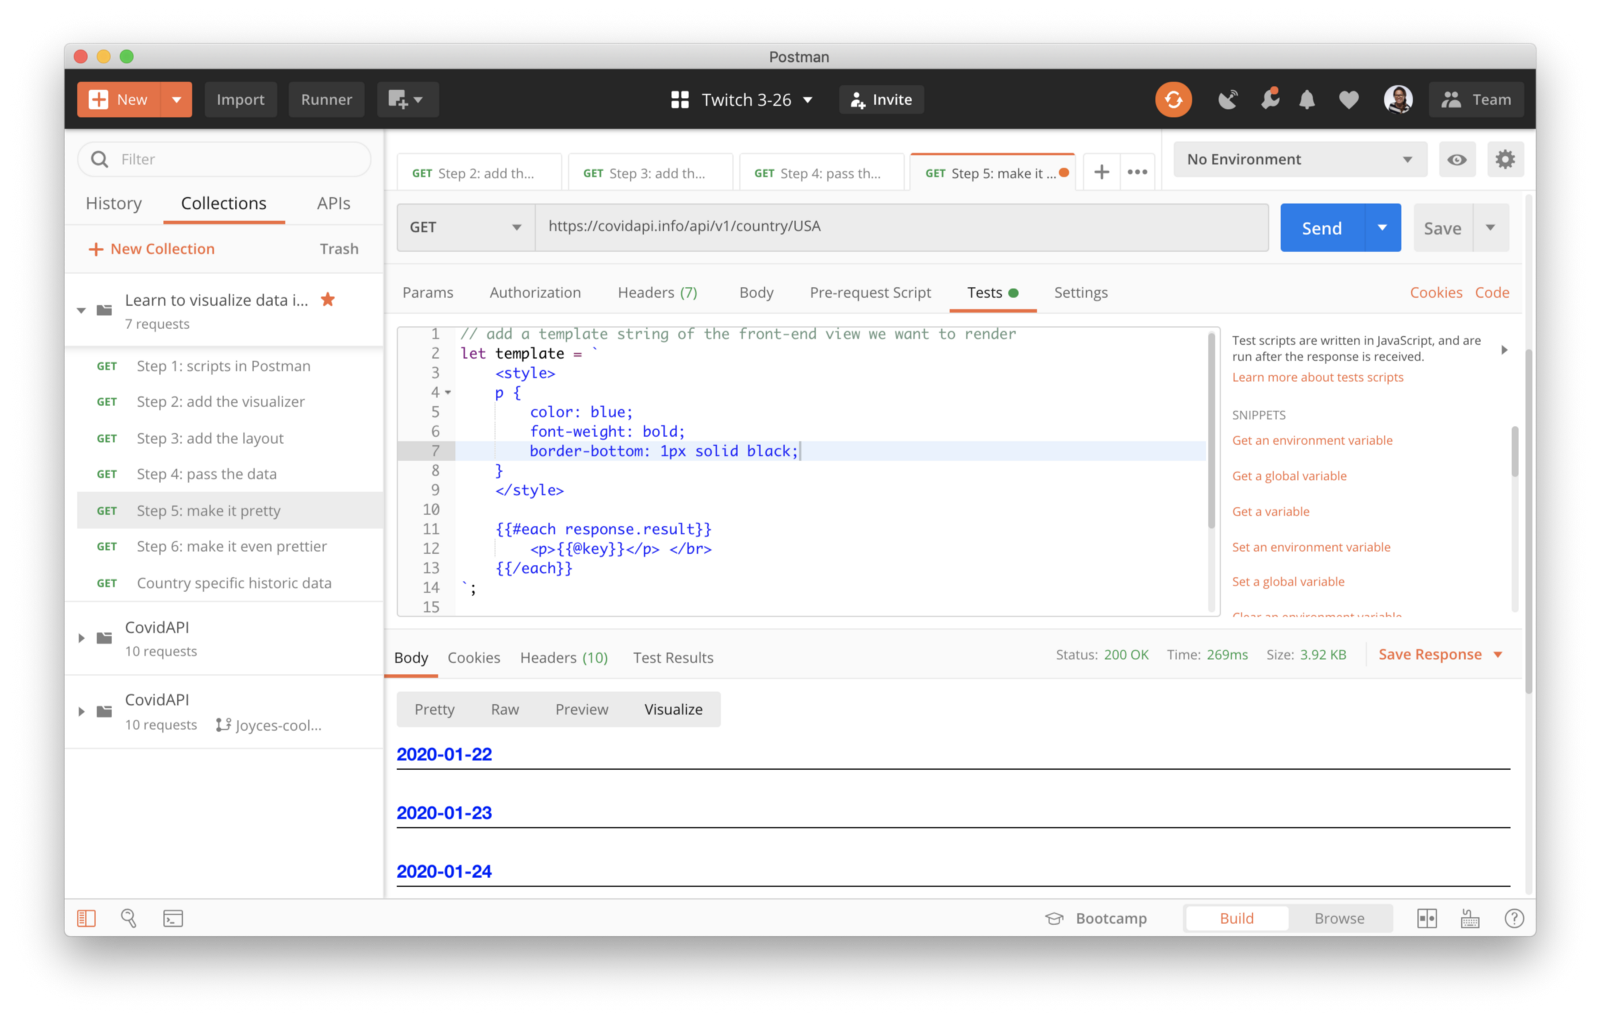
Do you feel pretty?
Right-click on the visualization, and select Inspect visualization to open Developer Tools. In this new window, you can inspect elements in your HTML visualization, log console statements from within the defined template, and dig deeper into what’s going on.
Under the Elements tab of Developer Tools, select an HTML element and update the CSS under the Styles tab to see real-time updates to the HTML rendered under the Visualize tab in Postman, like so: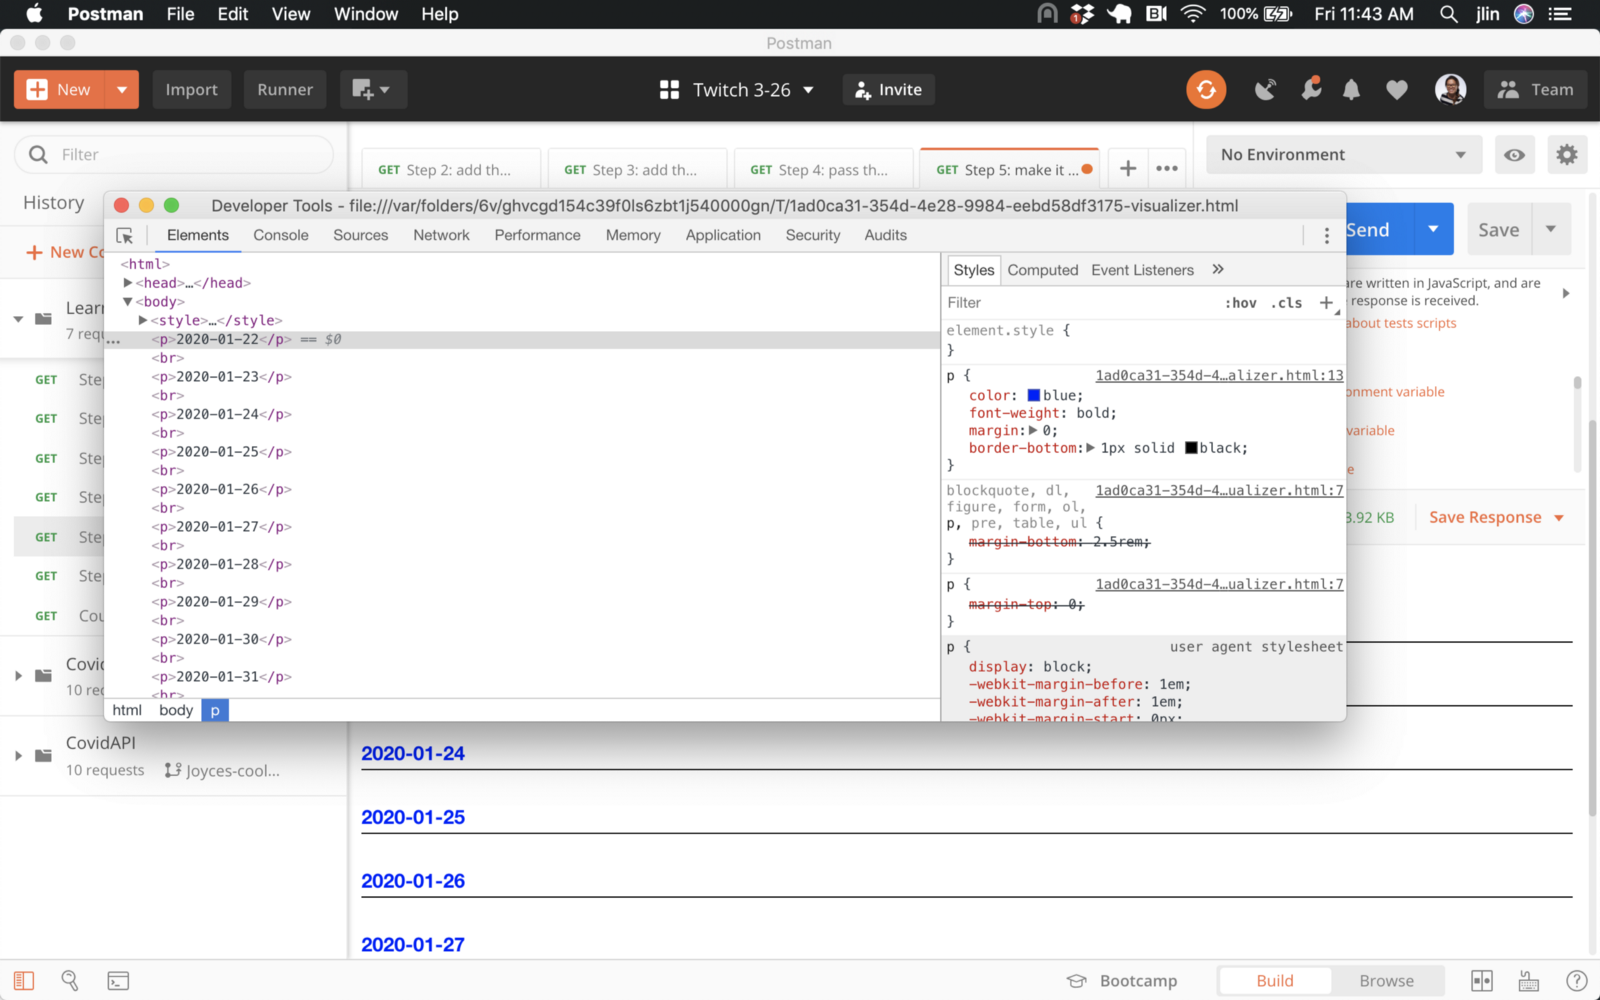
Neat, huh? Let’s try adding more JavaScript next.
Step 6: Make a line graph
We just learned how to style our visualization using HTML and CSS. Now, let’s add some more JavaScript to add interactions or external libraries using <script> tags inside our template.
If we revisit the data returned from our API, it would definitely be more interesting to visualize data over time, instead of this lovely but meaningless list of dates:
To do this, we’ll use the Chart.js library to make a line graph. Let’s take a look at a passage from their getting started documentation:
First, we need to have a canvas in our page. Replace the current code in your template string with this HTML element.
<canvas id="myChart"></canvas>
Now that we have a canvas we can use, we need to include Chart.js in our page. Add this script to the beginning part of your template string.
<script src="https://cdn.jsdelivr.net/npm/[email protected]"></script>
Now, we can create a chart. Add this script after your
<canvas>element within your template string. Don’t forget to surround this code block with an opening and closing<script>tag.
var ctx = document.getElementById('myChart').getContext('2d');
var chart = new Chart(ctx, {
    // The type of chart we want to create
    type: 'line',
    // The data for our dataset
    data: {
        labels: ['January', 'February', 'March', 'April', 'May', 'June', 'July'],
        datasets: [{
            label: 'My First dataset',
            backgroundColor: 'rgb(255, 99, 132)',
            borderColor: 'rgb(255, 99, 132)',
            data: [0, 10, 5, 2, 20, 30, 45]
        }]
    },
    // Configuration options go here
    options: {}
});
If you hit Send now, you can see a line chart under the Visualize tab that displays the data hardcoded in the boilerplate snippet. In Step 4, we learned how to pass the data from pm.visualizer.set() to access the data within our HTML template using the Handlebars double curly braces. If we want to access this data from within a JavaScript <script>, we can use pm.getData(callback).
The pm.getData(callback) method takes a callback function as its parameter. This callback method accepts two parameters: error and data. The second parameter is the data that was passed through pm.visualizer.set(). Wrap this bit of code around the boilerplate snippet (still inside the <script> tags):
pm.getData( function (error, data) {
    <! Boilerplate JS to execute using the data passed through from `pm.visualizer.set()` ---->
}
Now we have access to the data passed through from pm.visualizer.set(). In the boilerplate, we need to update labels for our data, as well as labels and data for our datasets. Once again, we will parse the information passed through from pm.visualizer.set().
Chart.js expects the labels for our data and the data for our dataset to be formatted as arrays. So the label would be a date like "2020-01-22", and the data for the dataset would be the corresponding value for that date.
Now we’ll update the array for the labels of our data. Here we are turning an object data.response.result into an array using Object.entries(), and then mapping each item in that array to return another array of the first property of each item. See if you can update label and data for our datasets on your own, like so:
...
labels: Object.entries(data.response.result).map( (item) => item[0]),
...
Hit Send, and see the beautifully visualized time series data for COVID cases under the Visualize tab of the response: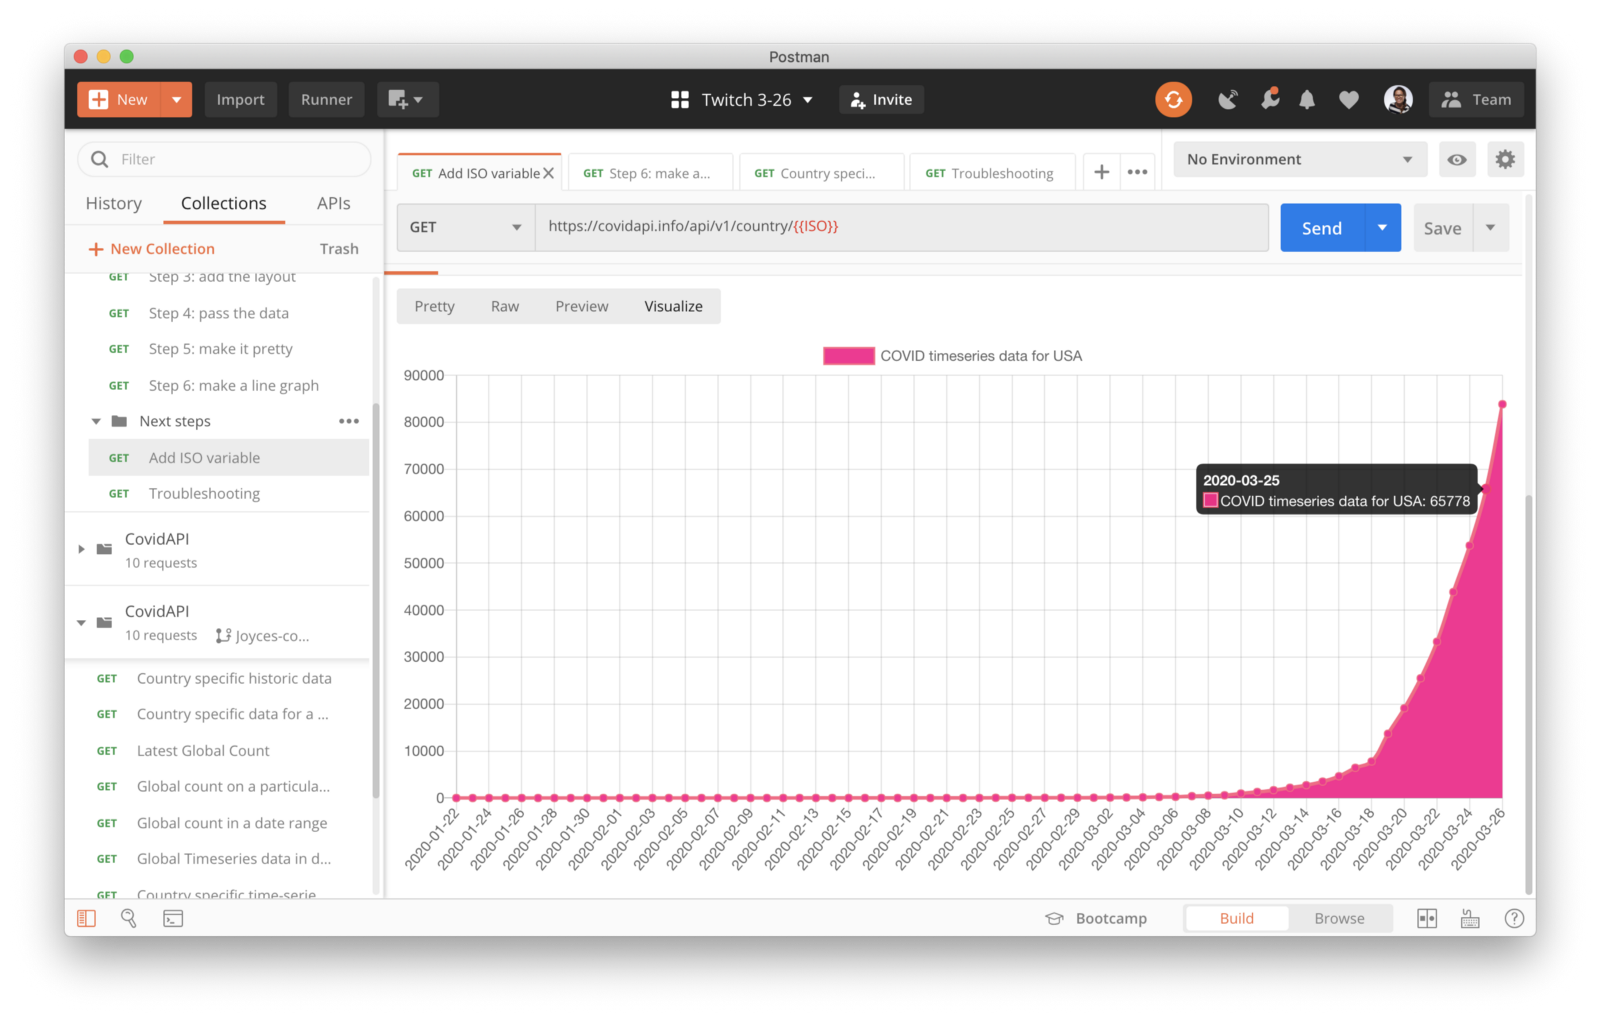
Final thoughts
This was a simple example with an easy-to-use API and a straightforward charting library. Just knowing the basics of these types of visualizations allows you to better understand data, stay informed, and help others.
Take a look at the rest of the example collection to continue exploring some enhancements, as well as tips for troubleshooting.
If you’d like to practice your skills and try out some additional ways to enhance this visualization, here are a few ideas:
- Display time series data for another value
- Display time series data for a different country
- Turn the country’s ISO in the URL and chart label into a variable
- Style the chart with the country’s flag colors
- Make it even prettier with CSS, Handlebars, Chart.js, or other libraries
- Compare two different countries within the same graph
Do you have other ideas? Check out Postman’s COVID-19 API Resource Center for more interesting data, and let us know in the comments below if you build something neat!


Hi,
I liked it what you have created. Sorry for all those who are lost. May Allah shower mercy on all of us.
Can you please let me know if I wanted to do it without post man how I can do it.
Regards,
Asad
This tutorial shows you how to use Chart.js in Postman. But if you want to know how to do it without Postman, Chart.js has very nice docs: https://www.chartjs.org/docs/latest/getting-started/
My query is Iam uploading multiple files in postman using body form days then uploading the file and file extension is one is .json and 2nd file is .flxr so how to validate these two files using the test scripts
Could you please help me?
Hello, is there a way to use visualize when running multiple requests from a collection?