Test your API’s performance by simulating real-world traffic with Postman
Don’t forget to register here to attend POST/CON 24, Postman’s biggest API conference ever: April 30 to May 1, 2024 in San Francisco.
When it comes to API testing, you may have wondered some or all of these questions:
-
How will my APIs perform in real-world situations?
-
How will the response times change when multiple users are sending requests at the same time?
-
Will my users see acceptable response times when my system is under load, or will they see errors?
-
How can I identify performance bottlenecks that may become major production issues?
If so, you’ve likely realized that as you scale, your API’s performance impacts the success of your products and business.
To address the above concerns, we recently launched early access to Postman’s exciting new API performance testing feature. Today, we are excited to announce the general availability of this game-changing update to the Postman API Platform.
API performance testing: what and why?
In today’s fast-paced digital world, providing a great user experience is essential to building a sustainable business and staying ahead of competitors. APIs have increasingly become the backbone of such modern businesses, and the quality and reliability of these APIs impact how customers experience a product. To ensure user success, you need to know that your APIs meet the expected functionality (through functional testing) and also that they can handle the expected traffic volume (through performance testing).
API performance testing involves simulating real-world traffic and observing your API’s resulting behavior. It is conducted to evaluate how well an API meets performance expectations for response time, throughput, and availability under the simulated load.
API performance testing can help you:
-
Ensure your API can handle the expected load and check how the API responds to changes in load (load is the number of parallel users hitting your APIs at the same time).
-
Optimize and improve the API’s performance to ensure a better user experience.
-
Identify any bottlenecks, latency, and failures and determine the scalability of the system.
Introducing API performance testing in Postman from your machine
Postman now has built-in capabilities for testing your API’s performance with your existing Postman Collections and requests. There are two core functionalities we will discuss in this post:
-
Using Postman to simulate load by having multiple parallel virtual users hit your endpoints.
-
Visualizing the performance of your APIs under the simulated load in real time. We will show you how to observe response times, throughput (requests hit per second), and error rates so you can keep tabs on your API performance metrics.
How to use Postman for API performance testing
You can use Postman’s Collection Runner to set up a performance test in Postman by following these steps:
Step 1: Select a collection, select an environment (optional), and click Run:
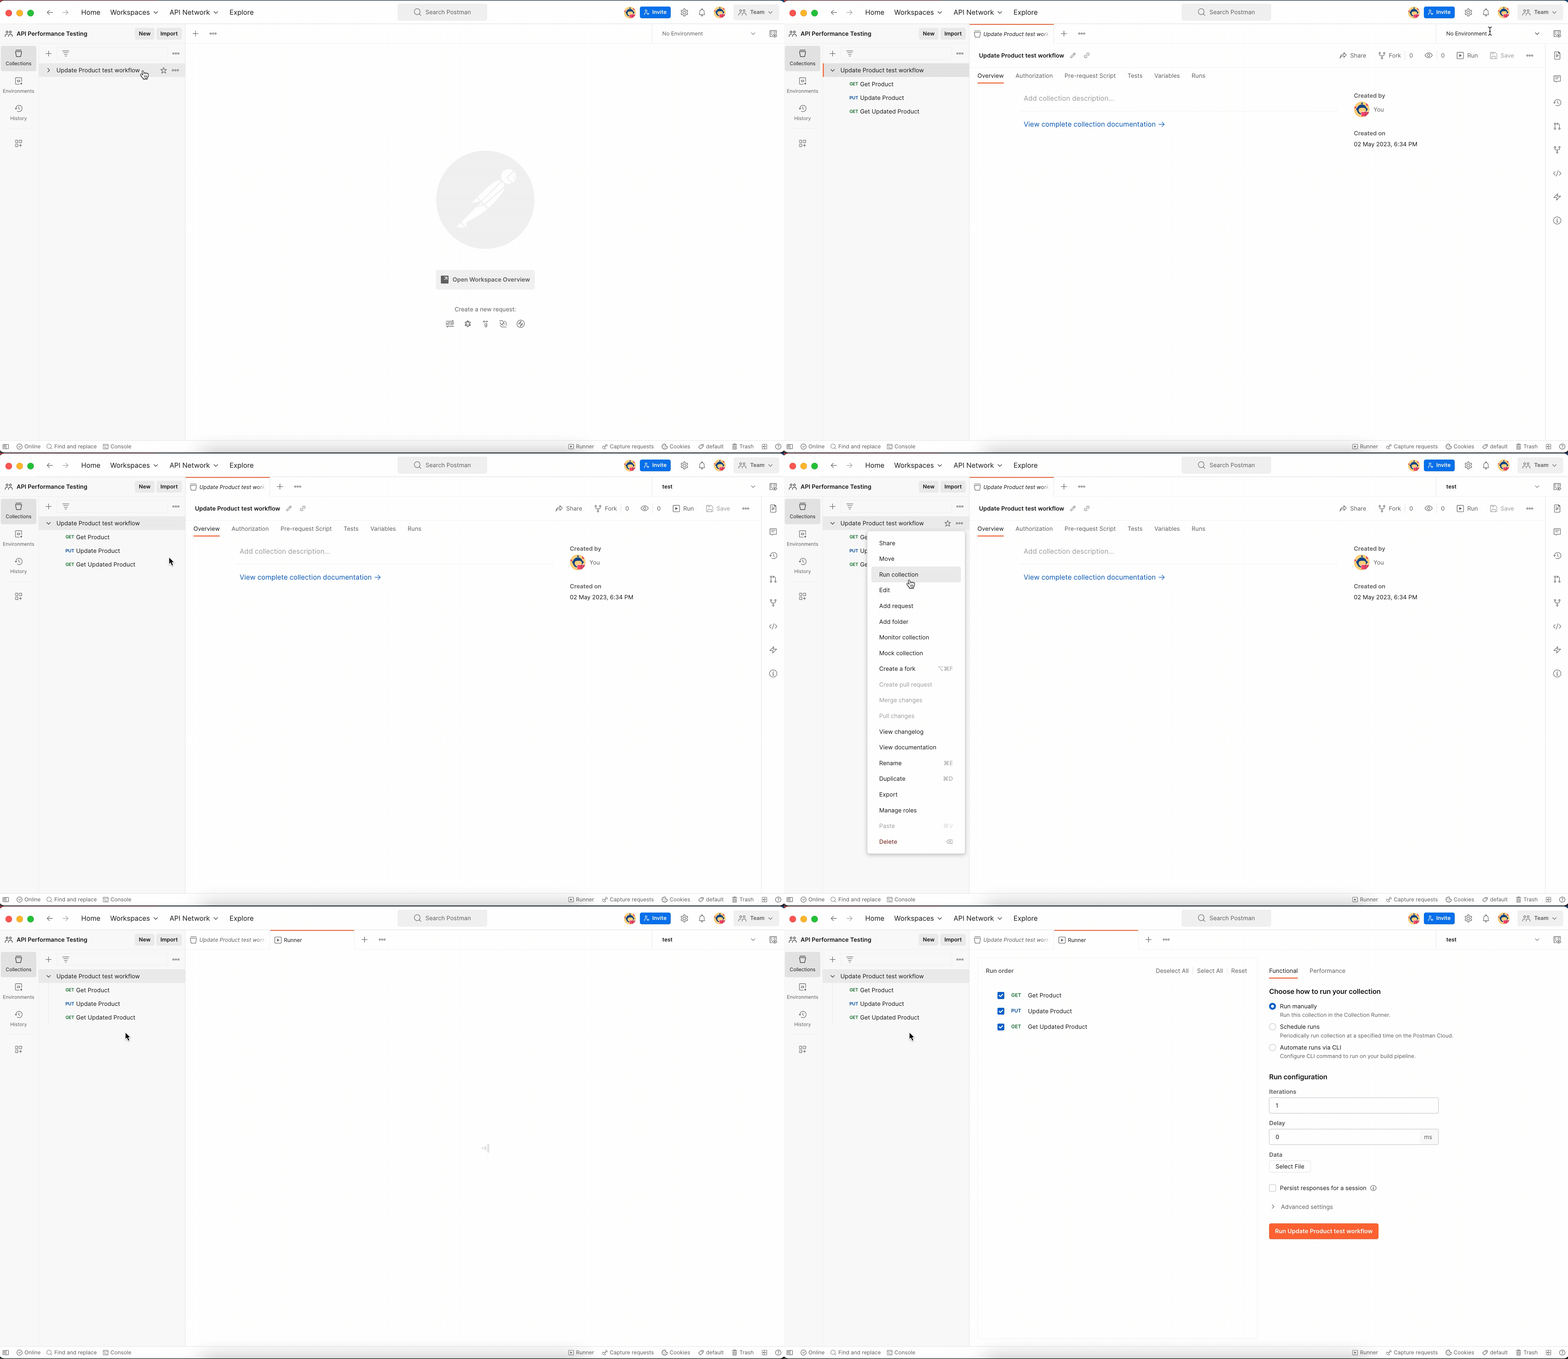
If you do not have a collection, read more about how you can quickly create one in Postman.
Please note that Postman will also execute all of your pre-request and test scripts along with the requests.
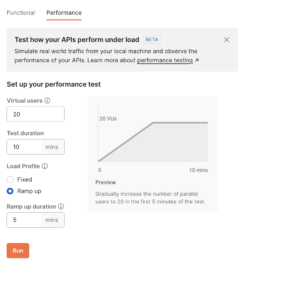
Step 2: Select the Performance tab under Runner, specify the load settings, and click Run:
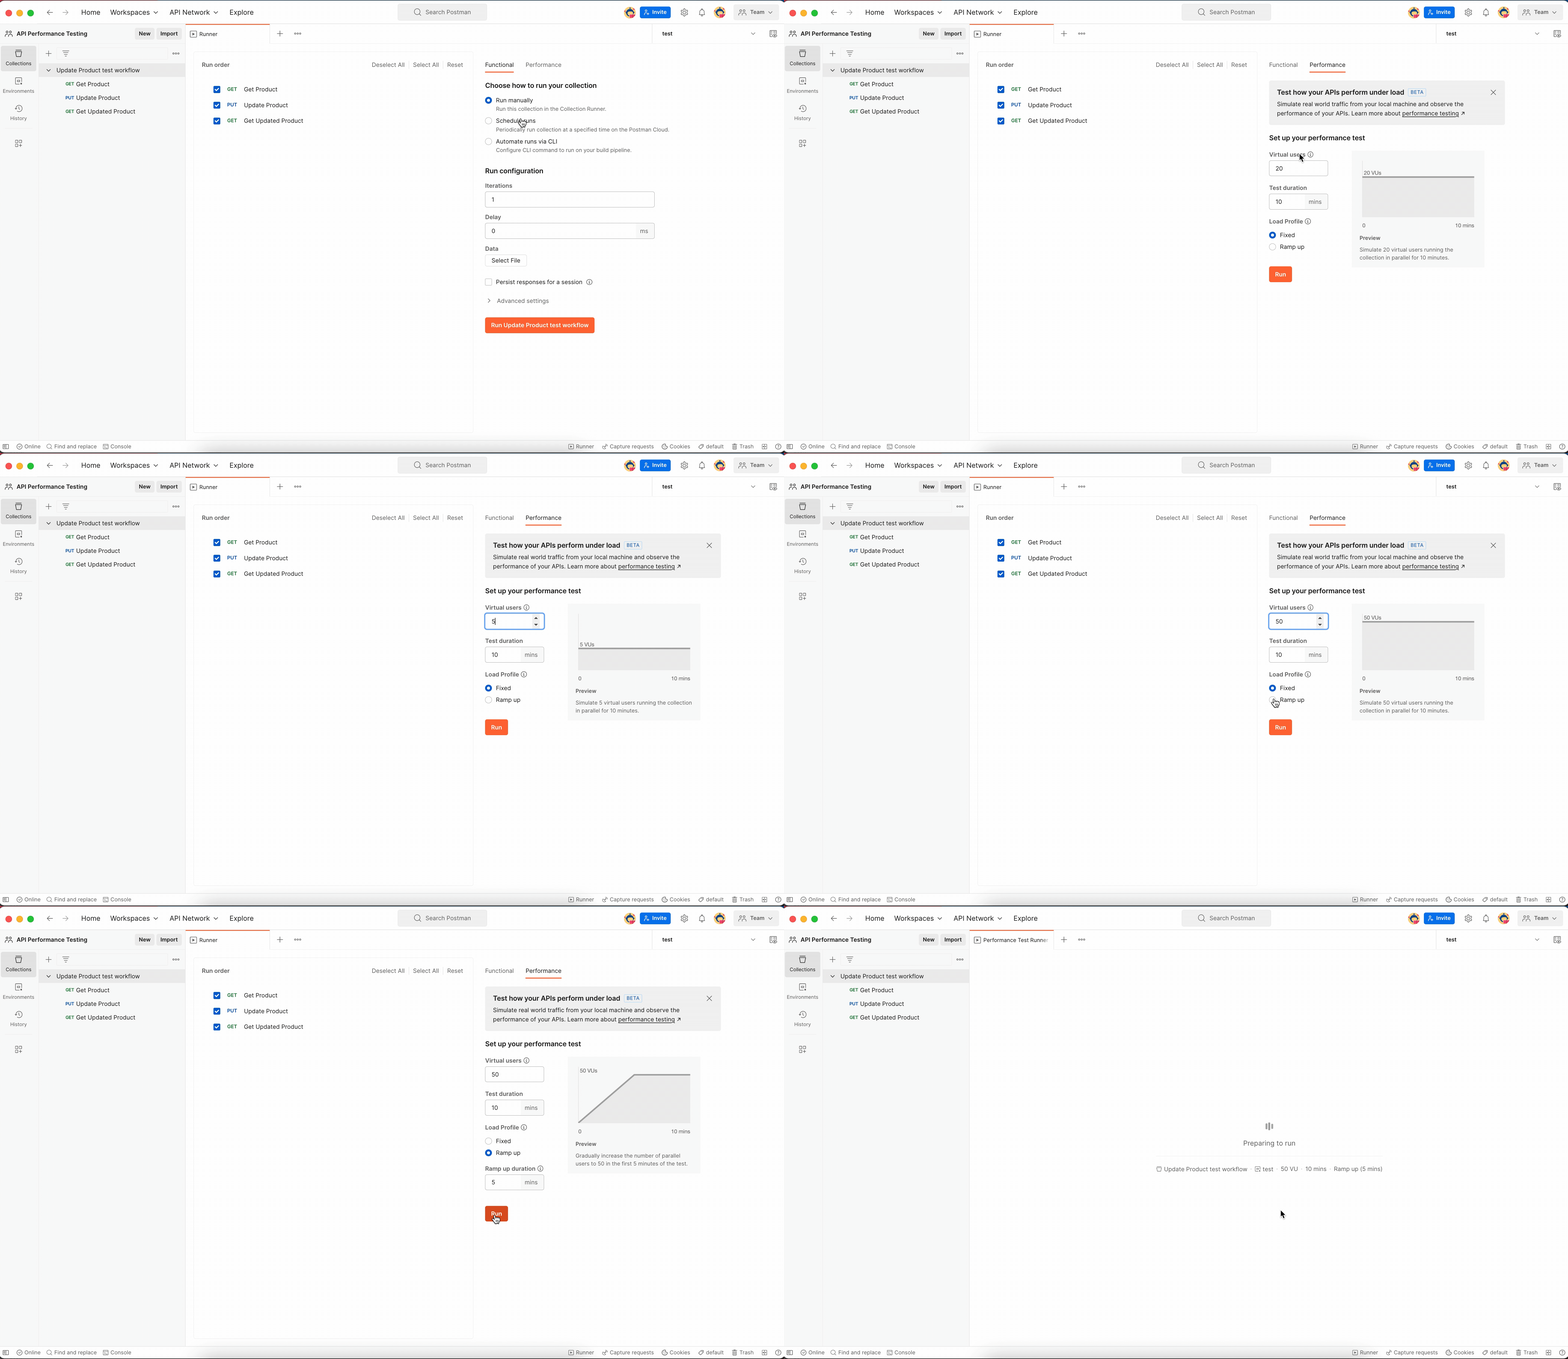
Step 3: Observe the response times and error rate in real time:
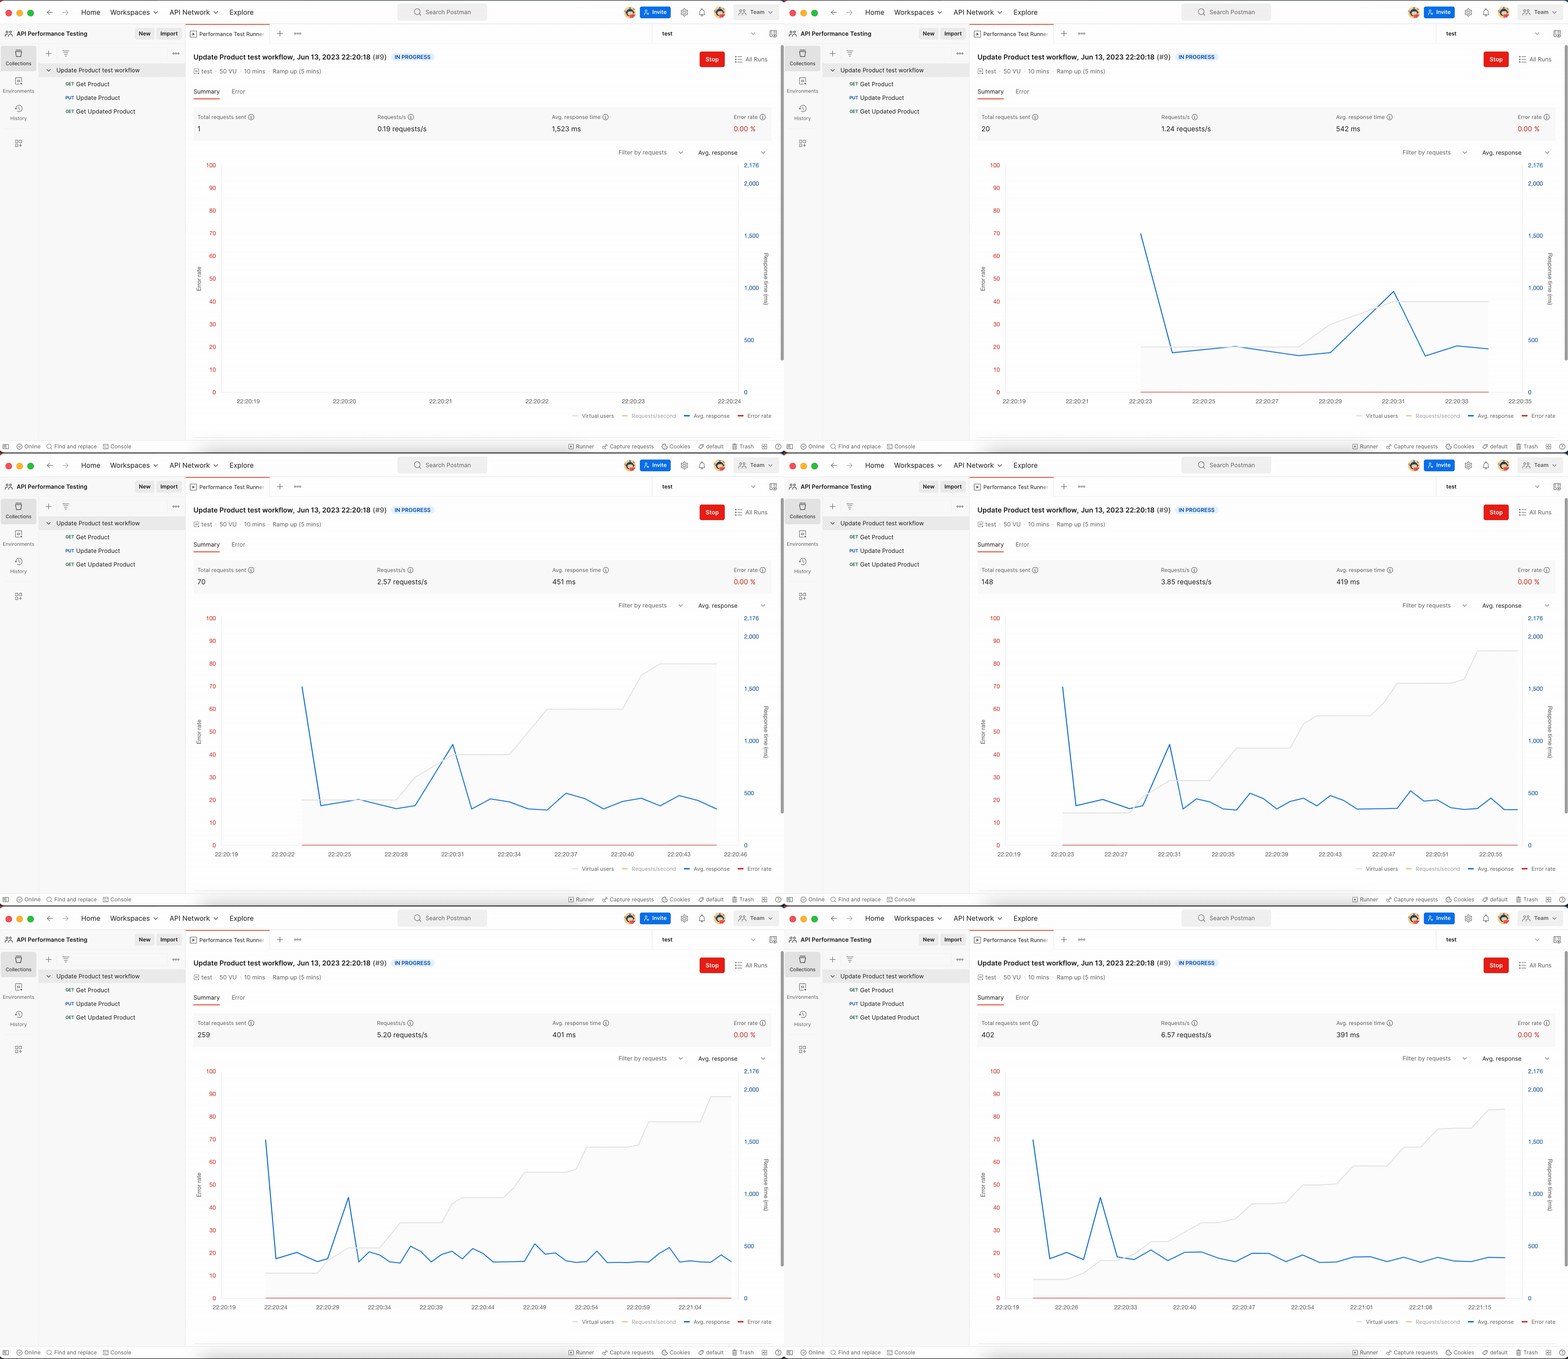
You can toggle on the legend to view requests per second as well.
Step 4: Once the run is completed, observe and identify bottlenecks in response times and requests per second:
How to configure the load to simulate real-world traffic
You can now use the Collection Runner to simulate real-world traffic. You will be able to specify the following inputs to simulate the load condition:
-
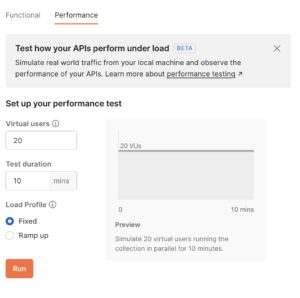
Virtual users (VUs): The maximum number of parallel users you want to simulate.
-
Test duration: The amount of time (in minutes) for which you want to run the test.
-
Load profile: The intensity of the load during the test’s duration. We currently support two load profiles:
-
“Fixed” load profile: This will apply a fixed number of virtual users throughout the test duration:
-
“Ramp up” load profile: This will slowly increase the number of virtual users during the “ramp up duration” to reach the specified load. Once reached, this number of virtual users will be maintained for the remaining duration:
-
How virtual users help you simulate load on your API workflows
Virtual users are the parallel users that will hit your APIs at the same time. Each virtual user executes the selected sequence of requests in the collection in serial order as represented on the Collection Runner. Multiple virtual users will run this sequence in parallel, creating a load for your API workflows. For example, a login request that’s followed by an add-to-cart request and a checkout request represents a workflow, and each virtual user will run through this workflow. If you wish to test your APIs in isolation, we suggest that you test a single request at a time.
Please note that since the virtual users are being simulated locally, there is a limit to the numbers you can simulate without running into memory or other issues. Learn more by reading our Learning Center documentation.
We are offering up to 100 free virtual users on our free plan. You can choose to upgrade to a paid plan for testing with a higher number of virtual users.
The ultimate objective of API performance testing is to ensure that your end users get a good experience when consuming your shipped APIs. Therefore, the type of traffic you choose to simulate during testing will depend on the kind of situations you expect your APIs to handle in the production environment.
Visualizing the metrics of a performance test
As soon as the performance test starts, you will be able to visualize and observe the performance of your APIs. Postman will show the following metrics in real time:
-
Average response time: This is the average of the response times received for the multiple parallel virtual users across the various requests.
-
Requests per second: The requests per second (throughput) metric helps you observe how many requests can be served by your API per second. Each virtual user is continuously hitting your endpoints, and depending on the response times, each virtual user can send multiple requests in a second. For example, setting up 10 virtual users to test a GET request that you expect to respond in ~200ms might produce 50 requests per second at best. However, the realistic number of request hits per second will depend on your API’s response time and other various factors, such as the use of pre-request or test scripts.
-
Error rate: This metric indicates the fraction of the requests that get a non-2XX response or face non-HTTP errors while sending the request.
Note that all of the above metrics are commutative across all your selected requests. Postman aggregates your metrics in short-term intervals. Subsequent metrics from consecutive time intervals are placed together, helping you visualize the changes to these metrics over time.
Troubleshooting errors in your performance test runs
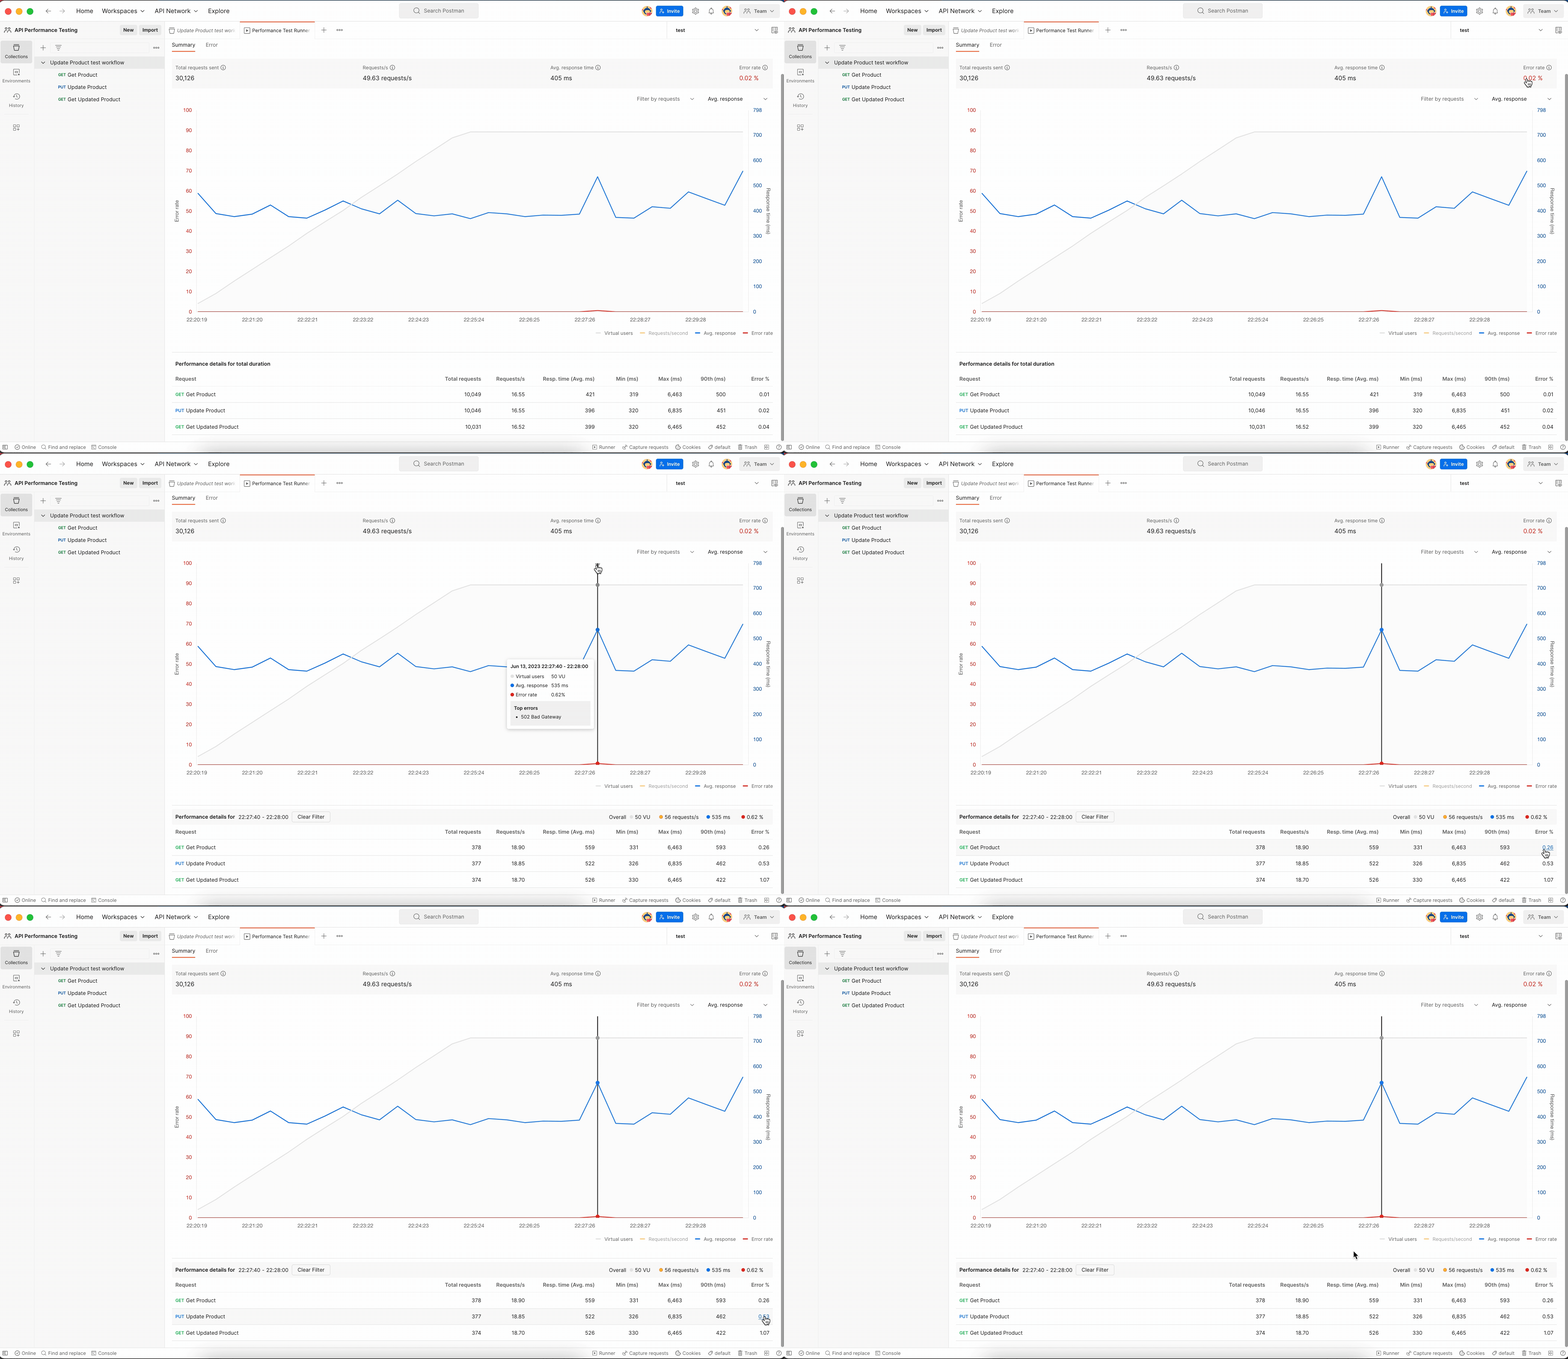
When your performance tests indicate elevated error rates and you would like to know more, you can simply hover over the point of interest and see what’s causing the spike. This helps you identify the cause of the error and troubleshoot the problem further, as shown below:
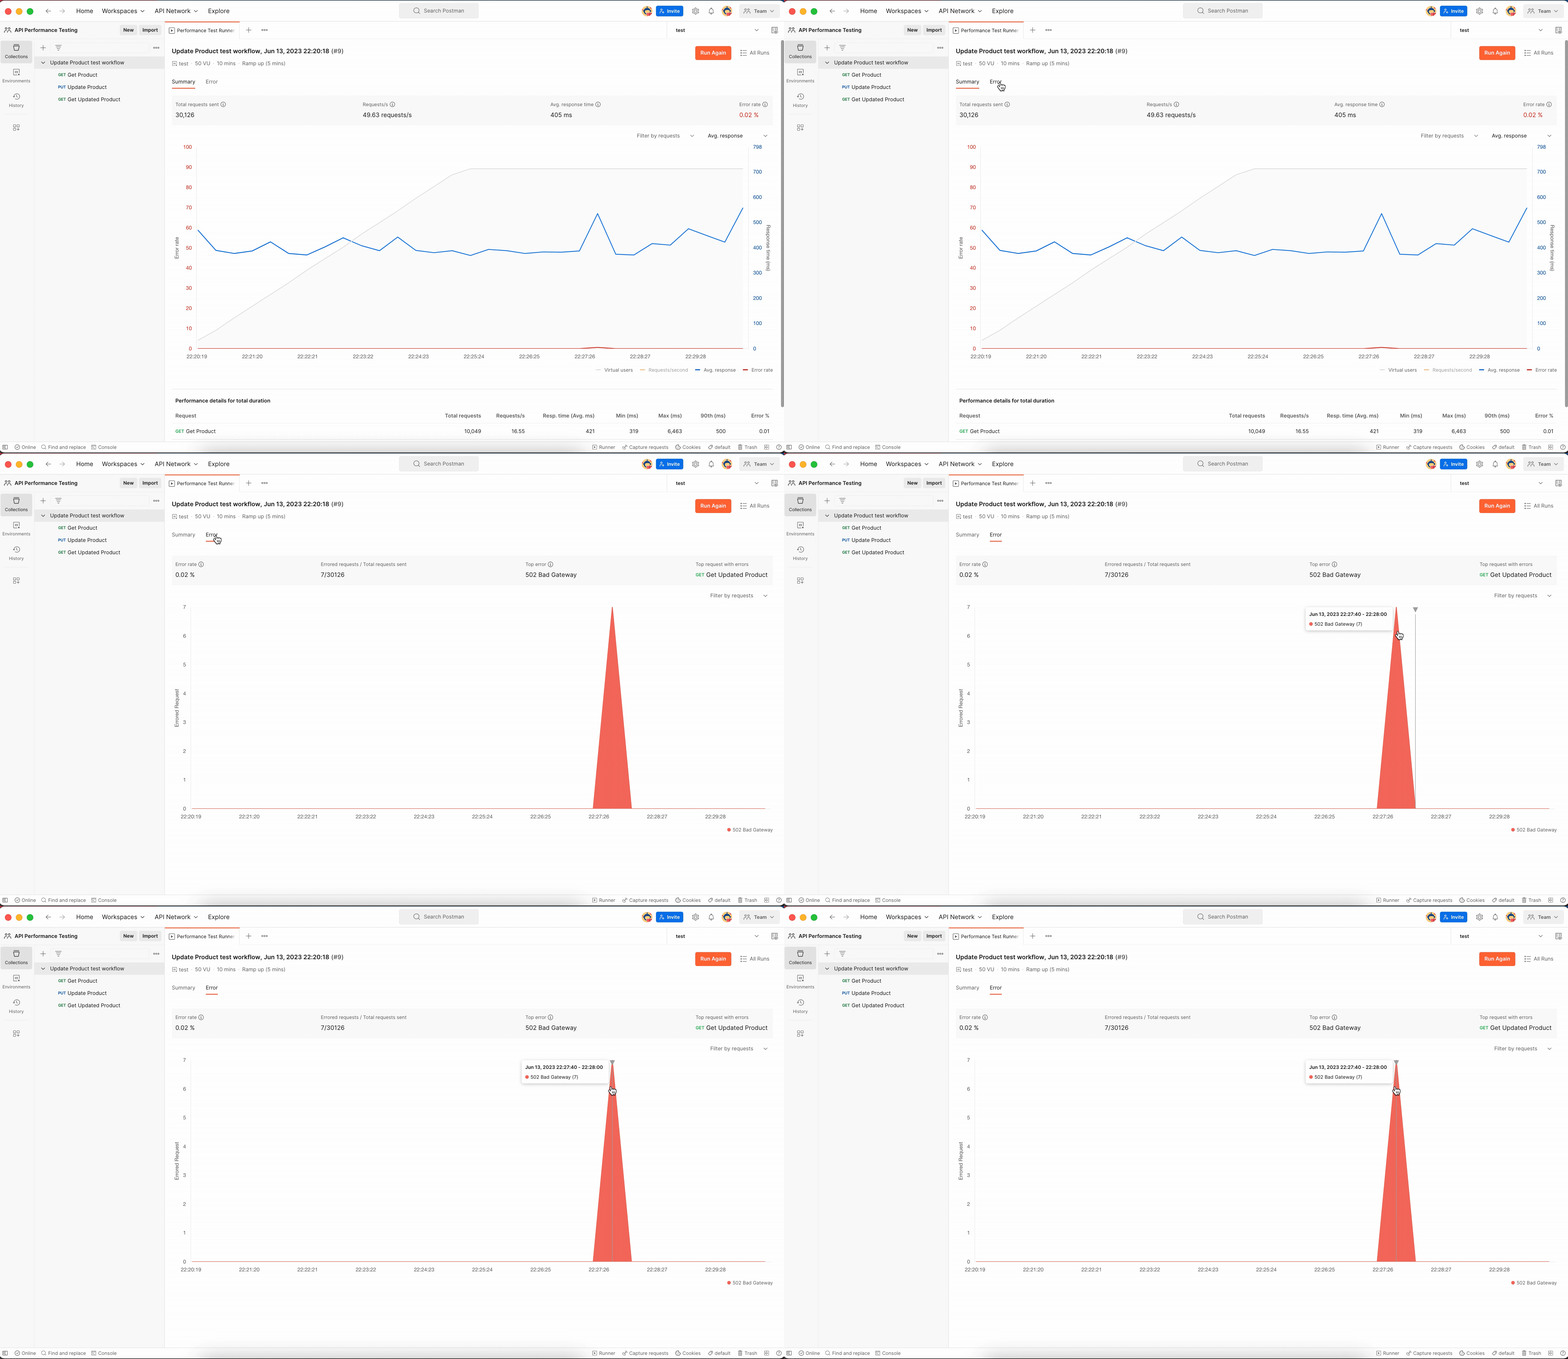
Once the run is complete, you can also click on the Errors tab to view the detailed error rate breakdown trend:
We’d like to give a big shout-out to our enthusiastic community of early adopters, who tried the product in our canary release and gave us feedback that led to this improvement!
Drill down into your metrics by request
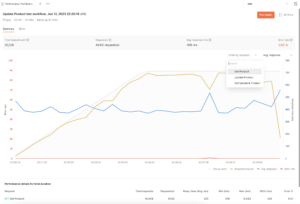
Request drill down lets you drill down into every request that has been executed by the many virtual users. This helps you identify which request could have contributed to a spike in the commutative average response times, enabling you to fix the problem.
You can also visualize the performance metrics of individual requests by selecting the required request in the available filter:
Viewing past performance test runs
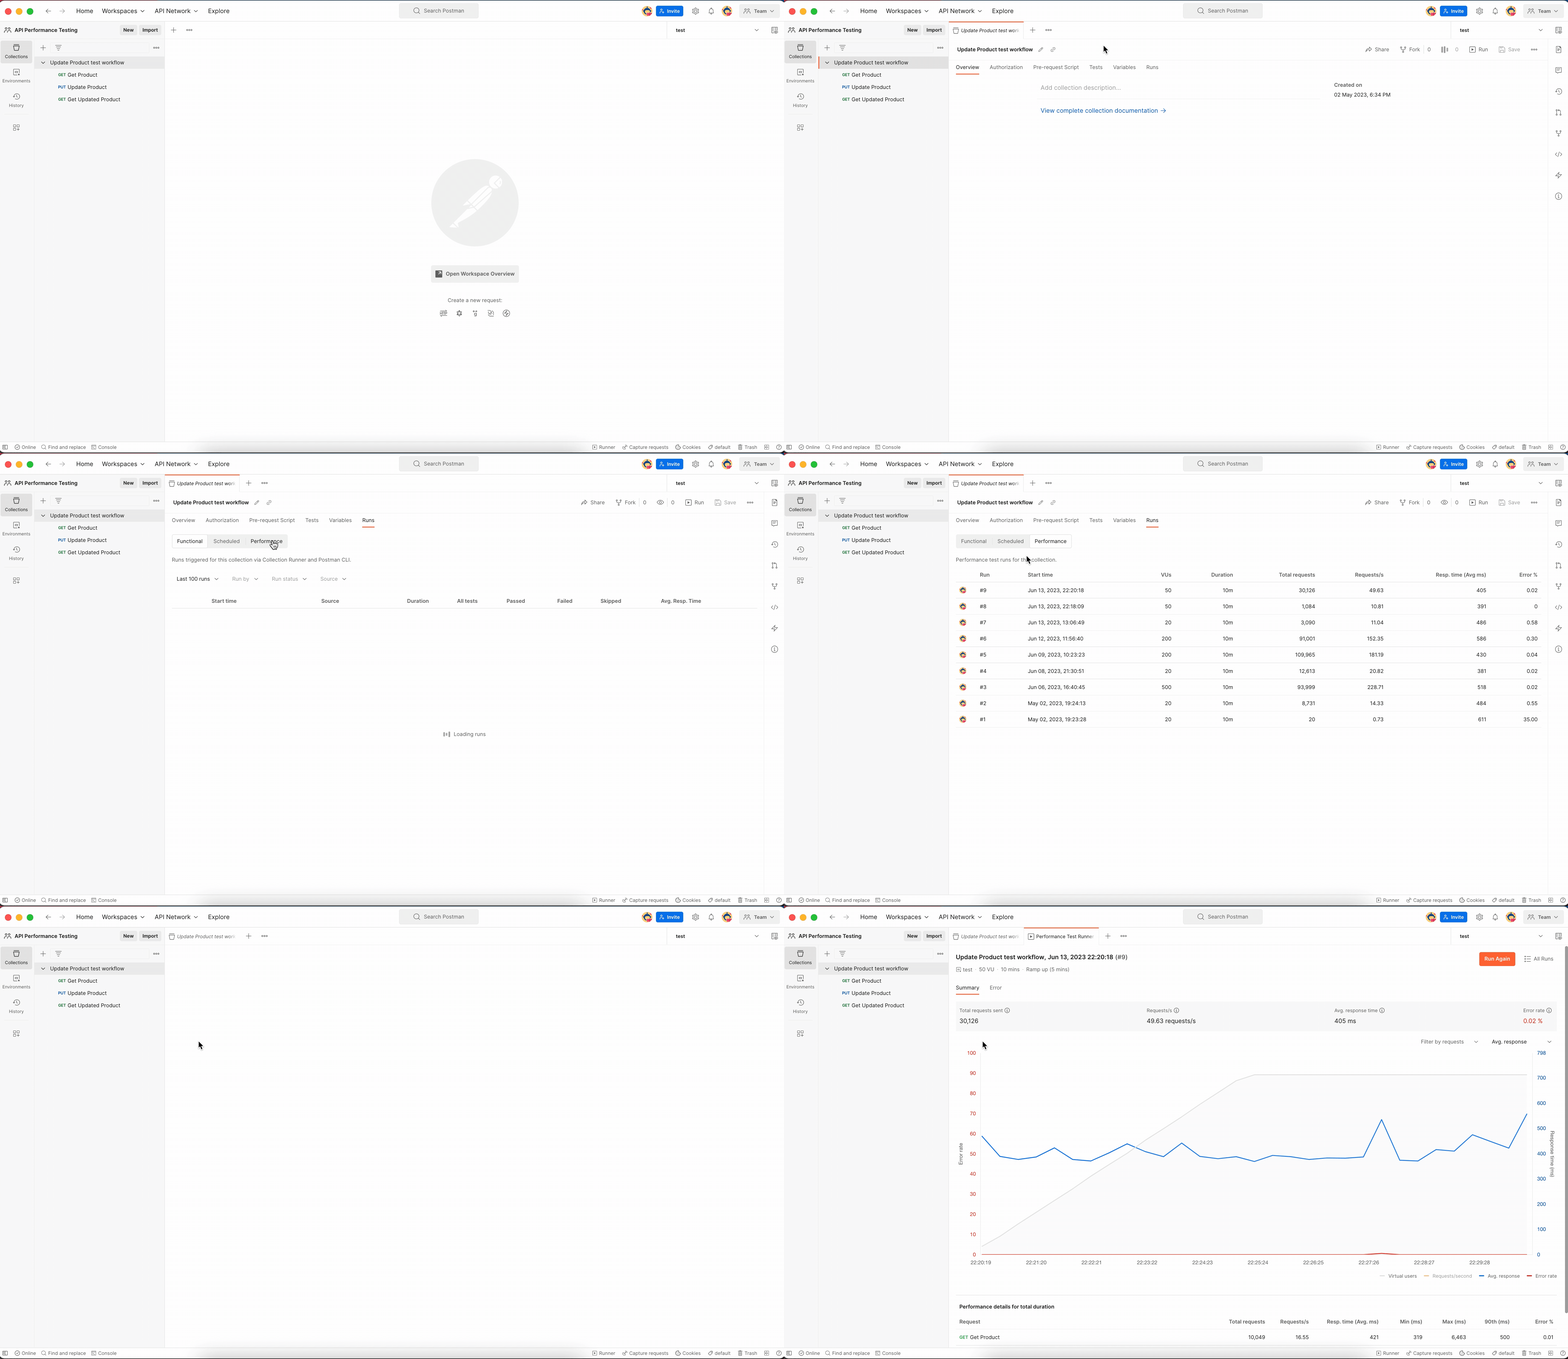
You can view the list of past performance test runs for a collection, as shown below:
We hope that with this new feature, you find it easier to test your API’s performance and make API performance testing part of your development lifecycles. Our goal at Postman is to democratize API performance testing for all the API developers and testers in the world, just as we did for API functional testing a few years ago.
Related: Use the API Performance Testing Template
You can learn more about API performance testing in our Learning Center. We are providing up to 25 performance test runs for free on a monthly basis in our free plan! You can upgrade to a paid plan for higher usage. Learn more about our different plans here.
You can schedule a time with a product manager to learn more about this feature or discuss your feedback in detail.

Hi Malvika, one problem we encountered with load testing is even with virtual users, load is coming from one client machine (source IP address). Does postman have a feature to work around this with a dummy client, or does this need to be setup outside of postman? (ie spinning multiple temp servers)
Hi Kaye,
Currently, Postman uses your local machine to simulate the load. Hence all requests are originating from a single IP. However, we are thinking of ways to solve this problem. I am curious to know if your usecase here is to increase the generate load by adding more machines or is it to simulate multiple different IP addresses.
We can talk about this over a call too, here is a link to my calendar if you like to block some time.
Regards,
Malvika
I have OAuth 2.0 configured for the requests at the folder level that is inherited. When I select the folder and then Run, select the tests to run performance testing on, they all get 401 Unauthorized. It’s not picking up the Auth settings from the parent folder…
hey Corey!
Thanks for your feedback. We have fixed this issue in our latest release(version Version 10.16.1). Please do give it a try and let us know if you still face an issue.
Regards,
Malvika
Hi!
I’m experiencing the same problem as Corey. Is there a way to make performance testing take over the auth settings from the parent folder when run from Postman UI?
Until this is fixed this feature has very little value for my team 🙁
As a performance test engineer for many years now, I think this could be a great product going forward. However a couple of questions – 1. are you able to read data from a csv file for the performance testing, 2. It would be good to have a throttling feature that you can use to limit the transactions per second/minute. This is necessary as an API’s performance is often measured in tps (transactions per minute). Look forward to hearing from you.
Hi Roger,
#1 This is in near term roadmap, we are also tracking this here: https://github.com/postmanlabs/postman-app-support/issues/12107
#2 I have started tracking this here:https://github.com/postmanlabs/postman-app-support/issues/12178 . However, I am curious to know more about the usecase of throttling. It would help if you can share more information on the ticket.
Thanks!
Malvika
Hi, I am able to run a Performance test successfully but I am wondering if I can use Postman CLI to run performance tests from Azure DevOps.
Is that possible yet? Kindly let me know.
Thank You in advance!
Best Regards,
Vineeth M
hi Malvika,
Kudos, to the feature, it makes performance testing accessible to all as part of the development process. Had a query regarding the feature currently we can use the Postman Automation feature in Azure DevOps using Newman CLI, would the same be possible for performance testing as well. Look forward to hearing from you.
hi Malvika,
Would we be able to run the performance headless using Newman CLI.
Hi Sreejith,
Thanks for the feedback. We are tracking this feature request here: https://github.com/postmanlabs/postman-app-support/issues/12008. I would like to understand your usecase further. It will really help if you can provide more information on this.
If you like to talk to me about this further, here is a link to calendar that you can use to block a time.
Regards,
Malvika
Hi Malvika, Is there a way to run 2 different API tests in parallel using a single collection or 2 collections?
Hi Randheep,
Currently, on the product you can only run a single performance test at once. It will help me to understand your usecase further. Are you looking to run two different load profiles on the same collection?
If you like to talk to me about this over a call, here is a link to my calendar that you can use to schedule some time with me.
Regards,
Malvika
Hi, I have been using this feature, but I noticed I cannot drill down to see individual responses for these requests. Is there a feature for this?
Hi Malvika — thank you for the very helpful tutorial. I echo Kaye’s comments — we have a similar problem. In our case, the simulation of multiple IP addresses would be sufficient
Hi Dane,
Thanks for your feedback. We are tracking this feature request on our github issue tracker here: https://github.com/postmanlabs/postman-app-support/issues/12309
Please feel free to provide any additional information that will help us understand your usecase or why you are looking to simulate multiple ip addresses better. If you like to talk to me, here is a link to my calendar that you can use to block some time.
Regards,
Malvika
How do you add data file like we do in “functional” in “performance” tab ?
Please contact our support team at http://www.postman.com/support and they’ll be able to help you.
I would like to know if there is a way to use different users with the performance test?, so each virtual user running can use a different user account with different data to perform a more realistic test
Hi Moi,
Thanks for the question. Yes, we are working on a solution that can help achieve the above. Tracking it here:https://blog.postman.com/postman-api-performance-testing/#comments
Dropping you a note on your email id to talk about this further.
Thanks!
Malvika
Is it possible to use a file and replace variables with the performance test so we are not calling the same requests with same header data all through the test?
Hi Ram,
Thanks for the question. We are actively working on this functionality. Tracking it on our github issue tracker here: https://github.com/postmanlabs/postman-app-support/issues/12107.
I would love to chat further with you regarding this, dropping you an email with a note.
Thanks!
Malvika
Hello There,
I was trying to do load testing on a Graphql API collection. When I am running the requests the API is working fine and giving away the responses. But when I am load testing the collection than I am always getting error message and the Error rate is always 100%. The error that I am getting is runtime:extensions~request: request url is empty. I am not sure why this is happening. Can you or anyone else please help me out in resolving this issue.
Thanks.
Please contact our support team at http://www.postman.com/support and they’ll be able to help you.
Nice writeup @Malvika.
Apparently max virtual user simulation is capped at 100 users.
How do I test beyond this using postman? As I can expect 5k TPS peaks.
Hi Malvika, could we code this by any chance, so that we could run in the CI in the daily runs, instead of running them in the postman App. Something from the test script in the CI to add more load to the collection.
Hi Malvika,
the performance test documentation says you can use a datafile with the performance testing, and specify fixed or random virtual users (https://learning.postman.com/docs/collections/performance-testing/testing-api-performance/ step 8). It doesn’t give me the opportunity to specify a datafile, nor can I find any other reference on google. Is this feature not yet implemented?
Thanks
This is really wonderful and easy to use. But, I would like to know more about chaining of requests here. Does Postman support that?
Hi Malvica,
I cannot click the run button, as they ask me to download a JSON file, It is weird because it is not showing on the demo you made. It is asking me to select the file, in this case, what should I select?
Please contact our support team at http://www.postman.com/support, and they’ll be able to help you.
Hello, Help!!!! The data file feature on the Performance section was removed from the most recent Postman version. Can you please re enabled the feature plz? We need to run a performance test very soon 🙁
Please contact our support team at http://www.postman.com/support, and they’ll be able to help you.
Thanks for this article. It’s very well explained. I am facing one difficulty though. I have a collection with 5 requests. Few of this requests expects a response with huge payload and also with response time more than 30 seconds. When I try to do a performance test with 10 vu in span of 5 mins then I can see error in my API logs which says “Client connection was closed”. Which means these postman requests are getting timed out in a way and not waiting for the response.
I have ofcourse increased the timeout value in postman from settings but I am not sure if it is also applying the same while running the performance test. Can you please suggest what can be done ?
Hi Malvika
I’ve setup a collection that dynamically generates an input for a request and when running a Functional test I am able to view request body and response data. However, when doing the same for a Performance Test, I’m unable to view each request and response per user. Is there a way to set this up and view this level of detail?
Regards
Can we get the ability to run this from cli?
We are using version 10.21.0 in our company and dont see the Performance tab. There is only Functional tab. Do we know why cant we see the performance tab?
Please contact our support team at http://www.postman.com/support, and they’ll be able to help you.