![Visualizing Open Brewery Data with Bootstrap [Data Visualization Example]](https://blog.postman.com/wp-content/uploads/2019/11/postman-api-visualizer-feature-1024x504.jpg)
Visualizing Open Brewery Data with Bootstrap [Data Visualization Example]
This tutorial is an introduction to the Postman Visualizer, showing you how to create a visualization of data returned from the Open Brewery DB. You should be able to follow the steps here regardless of your development experience level. By the end you will hopefully be able to apply what you’ve learned to virtually any Postman collection.
What you’ll need
- Postman client installed
- The Open Brewery DB endpoint (no key required!)
- A basic understanding of HTML and Handlebars (though you can copy-n-paste your way through this tutorial with zero knowledge)
1. Install Postman client
At the time of writing, the visualizer feature is only available on the Postman desktop client—available on Windows, Mac, and Linux. Download the latest version of Postman.
2. Create a new collection
There are a few ways to create a collection:
- When the Postman app first opens, click Collection in the welcome screen, or
- Click New in very top left of the app, or
- Select the Collections tab on the left, then + New Collection.
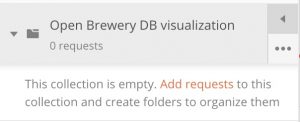
No matter which workflow you choose above, they all lead to the same modal window popping up. For this tutorial, name the collection “Open Brewery DB visualization” and click Create. (You can always edit this later.)
You should now see a new collection in the left sidebar.
If you have other collections, this will be inserted into the list alphabetically.
3. Add your request
In the left sidebar, click the “Open Brewery DB visualization” collection to open the drawer, then choose Add requests. A modal window will pop up—name the request “List of breweries” and save it. Click the new request to open it.
This should create a GET request. If you see the request listed as POST or something else, use the dropdown menu to the left of the “Enter request URL” input field and select GET, then Save.
4. Add the endpoint
We will be using the open API endpoint provided by Chris Mears’ Open Brewery DB—no key is required.
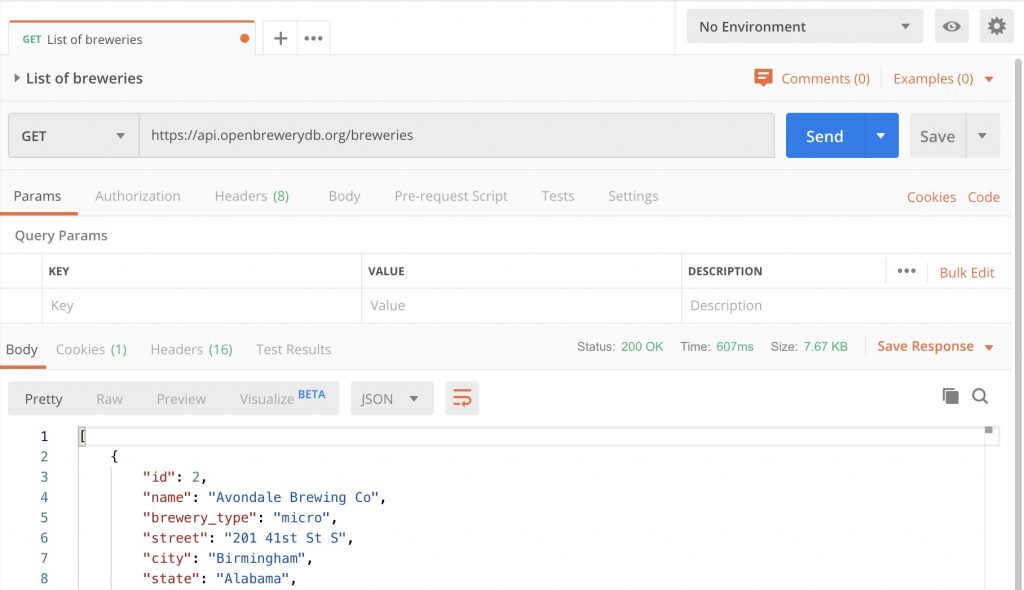
Enter the following URL into the address bar in Postman:
https://api.openbrewerydb.org/breweries
Click Send and you should see the first page in the response with 20 IDs/breweries.
5. Add the visualizer method
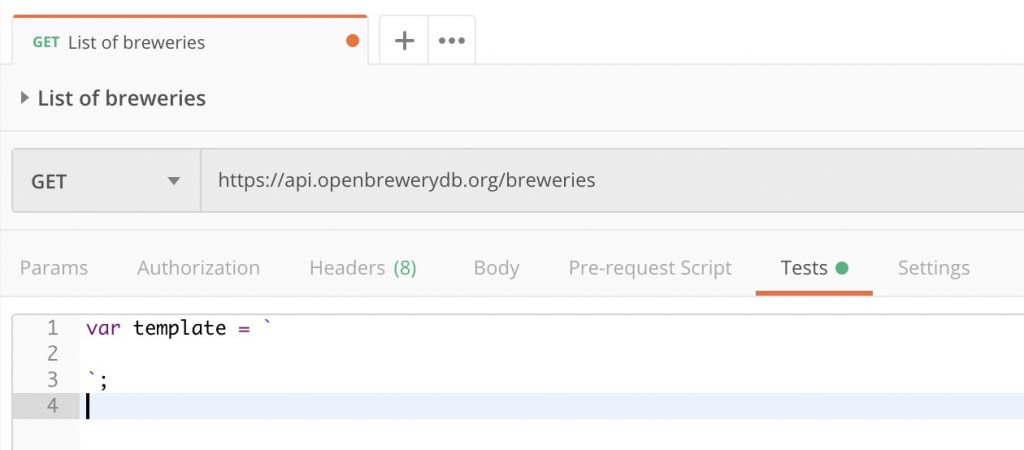
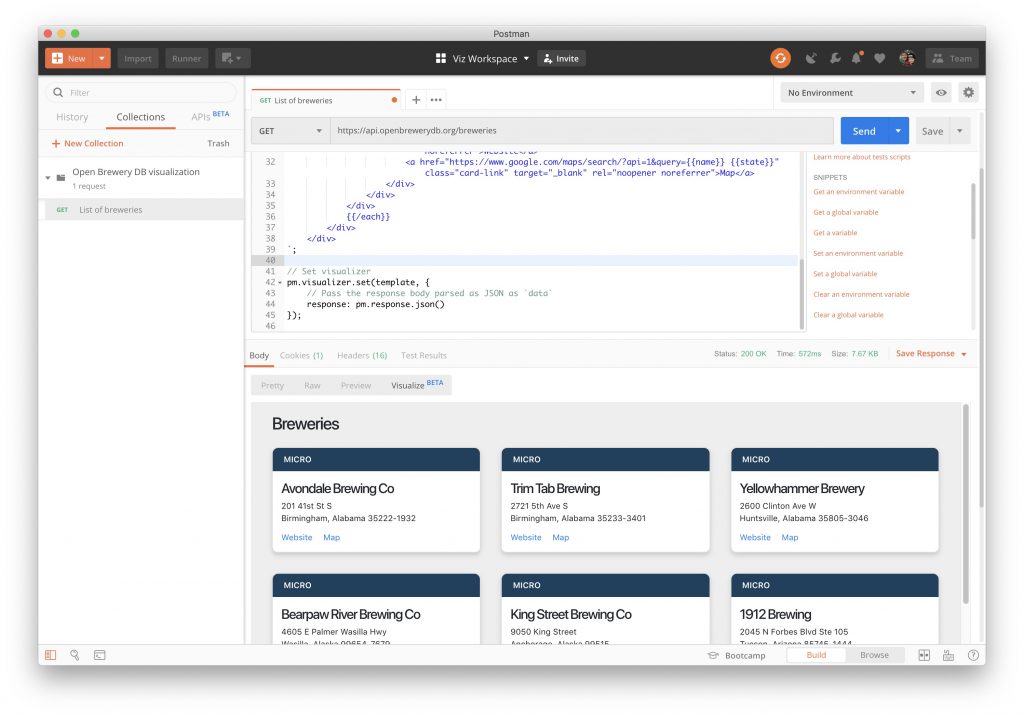
Open the Tests tab for your request and add the following code outline:
var template = `

`;
If you prefer let to var, you can use that. I’m going with var because I already took the screenshots.
This variable will hold our ‘web page’, or visualization HTML and CSS. It’s important to note that we are using a variable with template literal (enclosed in backticks) here, allowing us to use inline code inside that. The pm.visualizer.set() method (up next) accepts a Handlebars template string as its first parameter—the second being the data we wish to display.
Next, we are going to add the visualizer method. Copy and paste the following into the Test tab after the code you already entered:
// Set visualizer
pm.visualizer.set(template, {
    // Pass the response body parsed as JSON as `data`
    response: pm.response.json()
});
At this point you have the bare minimum needed to use the Visualize tab—select it in the lower pane to see the output of any request you’ve sent. Up until now, the response in the Visualize tab for this request would be “Can’t visualize the response,” and now it is blank. Go ahead and enter “TEST” between the template variable backticks and click Send. You should see “TEST” printed in the Visualize tab area.
6. Add the HTML and CSS
It’s time to add in the HTML and CSS to visualize the data. Update the template variable with the following code:
let template = `
    <link rel="stylesheet" href="https://stackpath.bootstrapcdn.com/bootstrap/4.1.3/css/bootstrap.min.css" integrity="sha384-MCw98/SFnGE8fJT3GXwEOngsV7Zt27NXFoaoApmYm81iuXoPkFOJwJ8ERdknLPMO"
        crossorigin="anonymous">
    <style type="text/css">
        body { font-size: 12px; background: #eee; padding: 16px;}
        .card { border-radius: 8px; box-shadow: 0 4px 10px rgba(0,0,0,.15); -webkit-box-shadow: 0 4px 10px rgba(0,0,0,.15); -moz-box-shadow: 0 4px 10px rgba(0,0,0,.15);}
        .card-topper { border-top-right-radius: 8px; border-top-left-radius: 8px; padding: 8px 16px; font-size: 12px; font-weight: 600; text-transform: uppercase;}
        .card-topper.micro { background-color: #173F5F; color: #ffffff;}
        .card-topper.planning { background-color: #ED553B; color: #ffffff;}
        .card-topper.large { background-color: #ED553B; color: #ffffff;}
        .card-topper.brewpub { background-color: #20639B; color: #ffffff;}
        .card-topper.regional { background-color: #F6D55C;}
        .card-topper.contract { background-color: #3CAEA3; color: #ffffff;}
        .card-topper.proprietor { background-color: #ED553B; color: #ffffff;}
        .card-topper.bar { background-color: #ED553B; color: #ffffff;}
    </style>
    <div class="container-fluid">
        <div class="row">
            <div class="col mb-4">
                <h1>Breweries</h1>
            </div>
        </div>
        <div class="row">
            {{#each response}}
            <div class="col-sm-6 col-lg-4 col-xl-3 mb-5">
                <div class="card">
                    <div class="test card-topper card-img-top {{brewery_type}}">{{brewery_type}}</div>
                    <div class="card-body">
                        <h2>{{name}}</h2>
                        <address>{{street}}<br>{{city}}, {{state}} {{postal_code}}</address>
                        <a href="{{website_url}}" class="card-link" target="_blank" rel="noopener noreferrer">Website</a>
                        <a href="https://www.google.com/maps/search/?api=1&query={{name}} {{state}}" class="card-link" target="_blank" rel="noopener noreferrer">Map</a>
                    </div>
                </div>
            </div>
            {{/each}}
        </div>
    </div>
`;

pm.visualizer.set(template, {
    response: JSON.parse(responseBody)
});

pm.test("Status code is 200", function () {
    pm.response.to.have.status(200);
});
It might feel weird not using DOCTYPE, html, head, and body tags, but know that they are not required for this to work in the visualizer.
What we are doing here is:
- Importing Bootstrap via CDN
- Adding some custom styling with the style tag
- Generating one row with one card inside a Handlebars template (note the
{{#each response}}) - The Handlebars built-in
eachblock helper will loop over the response and bring us the values for each double-bracket you see in side the template
For this example, the response is named “response”—you may need to update this for other endpoints.
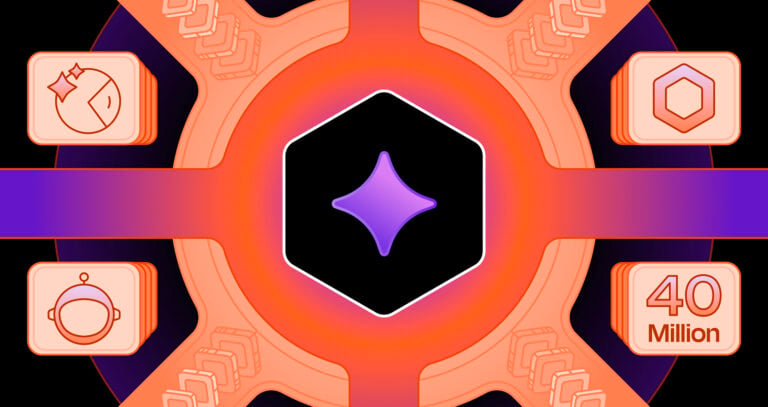
7. That’s it, hit Send!
Click Send and select the Visualize tab to view the response data displayed as rows of cards.
Or, skip the copy-n-pasting and just import it!
You can import the above tutorial as a collection with the Run in Postman button below. You’ll also get additional visualizations for the Open Brewery DB for filtering by state, by name, and by term—so you’ll see three more requests in the collection.
You can read more about the Postman Visualizer in our Learning Center.
Or, follow along with Kyle
You can follow along on our latest video tutorial by Postman’s Technical Support Engineer, Kyle Calica.


Is it possible to use the handlebars custom helpers in visualizer? I already tried that, but nothing happened
I too tried the helpers and could not get it to work. I’ll ping the team to see if there is a way to use them here.