Introducing Postman’s API performance testing troubleshooting features
We recently introduced the ability for you to test your API performance in Postman from your local machines by simulating real-world traffic and observing your performance metrics. Our canary user community was instrumental in giving us useful feedback that helped us quickly improve the product in the months that followed. One such feedback was around the ability to troubleshoot errors that are observed during API performance testing in Postman.
While running an API performance test on your HTTP Requests in Postman, you might receive a non-2XX response code (such as 401, 502, etc.) or a non-HTTP response. Such responses are grouped under Errors in Postman and represented by the red curve on the graph as shown below:
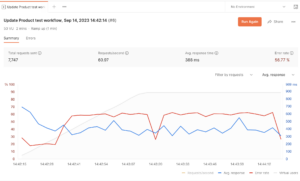
To troubleshoot these errors and fix them, you need to identify what these errors are and why they are happening. Our users indicated that without further details on these errors, they would have to look into the server logs for any kind of debugging. Looking into server logs and relating the same to client behavior is confusing, cumbersome, and slow.
In order to enable greater productivity, we have built a new solution now available in our latest release.
Introducing error troubleshooting on API performance runs
Error troubleshooting involves identifying the error and understanding the root cause behind the error. With our recent release, you can now easily obtain both of these pieces of information in Postman.
Identifying the errors
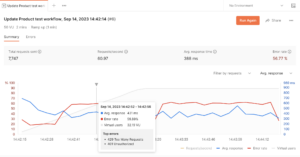
To identify the errors, you can simply hover over the graph while a run is happening to see up to the top three error types:
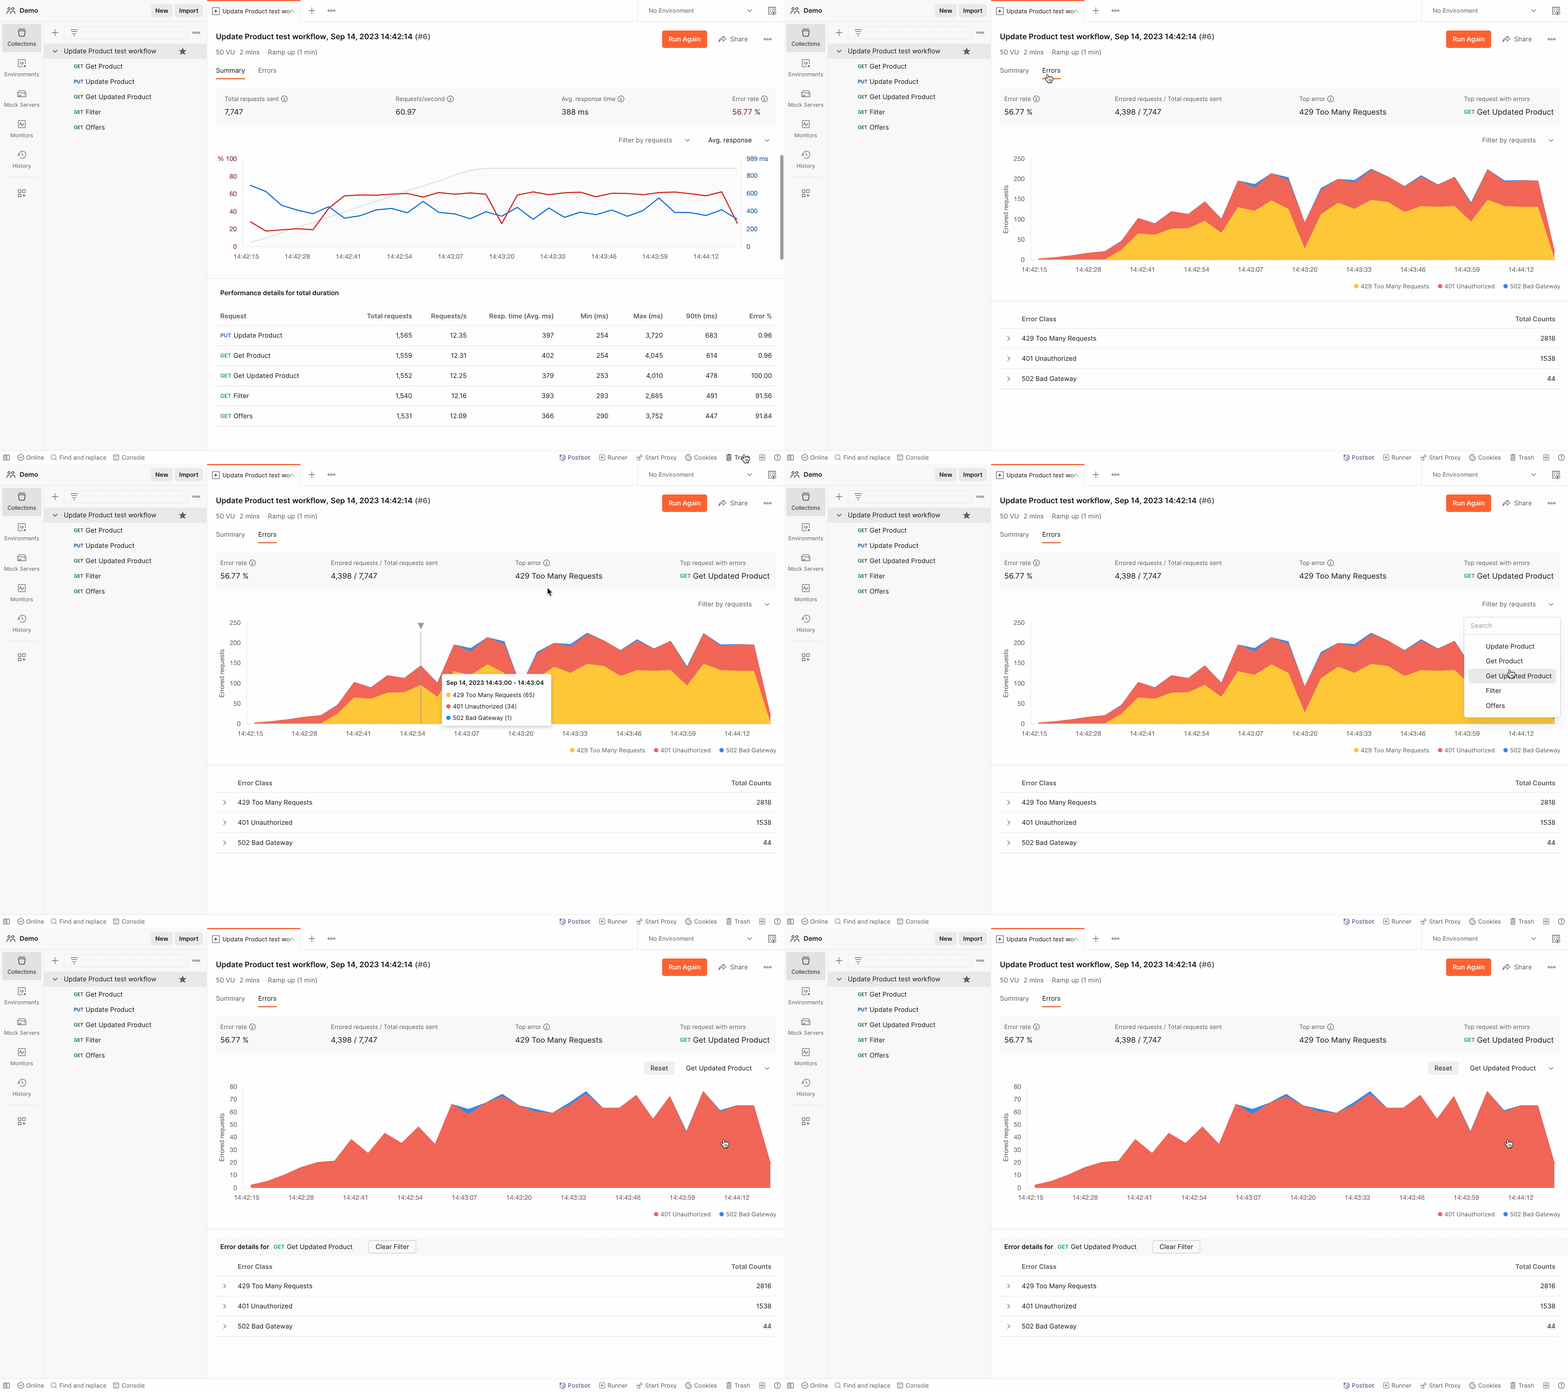
You can also click on the error rates for individual requests on the metrics breakdown table and check the errors for a particular request. To visualize the error trends by clicking on the Errors tab as shown below and even filter for a particular request:
How to identify the root cause
Identification of the root cause involves looking at further details on what request was sent to the server and the response received from the server. Therefore, you need to look into the request URL, request header, request body, response header, and response body. This will help you in many ways—such as identifying the resolved values of the variables in the request, the response body received from the server, and more.
To troubleshoot the errors, follow these steps:
Step 1: Click on the Errors tab and expand a particular error class:
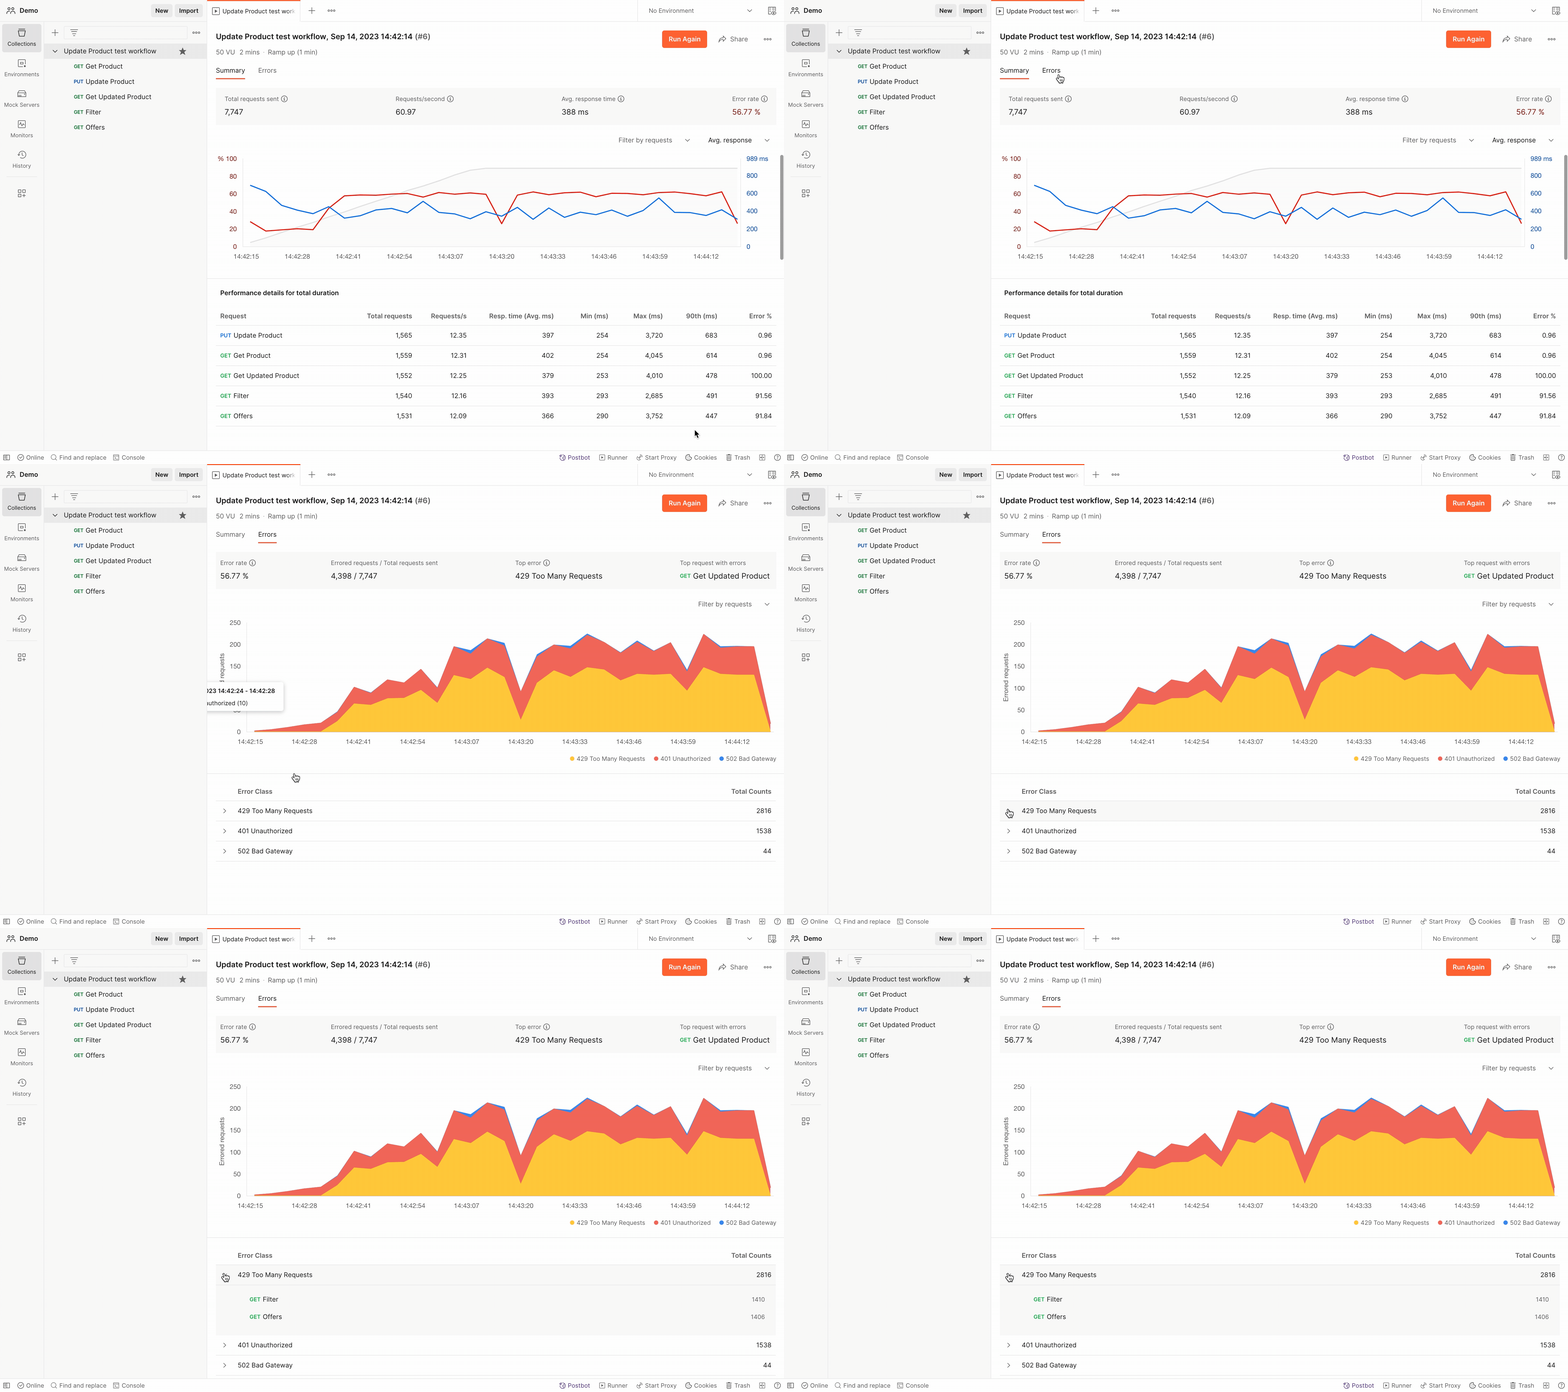
Step 2: Click on a given endpoint and see the response body, request body, and the associated headers. You can also check the count of a certain error class for a given request here.
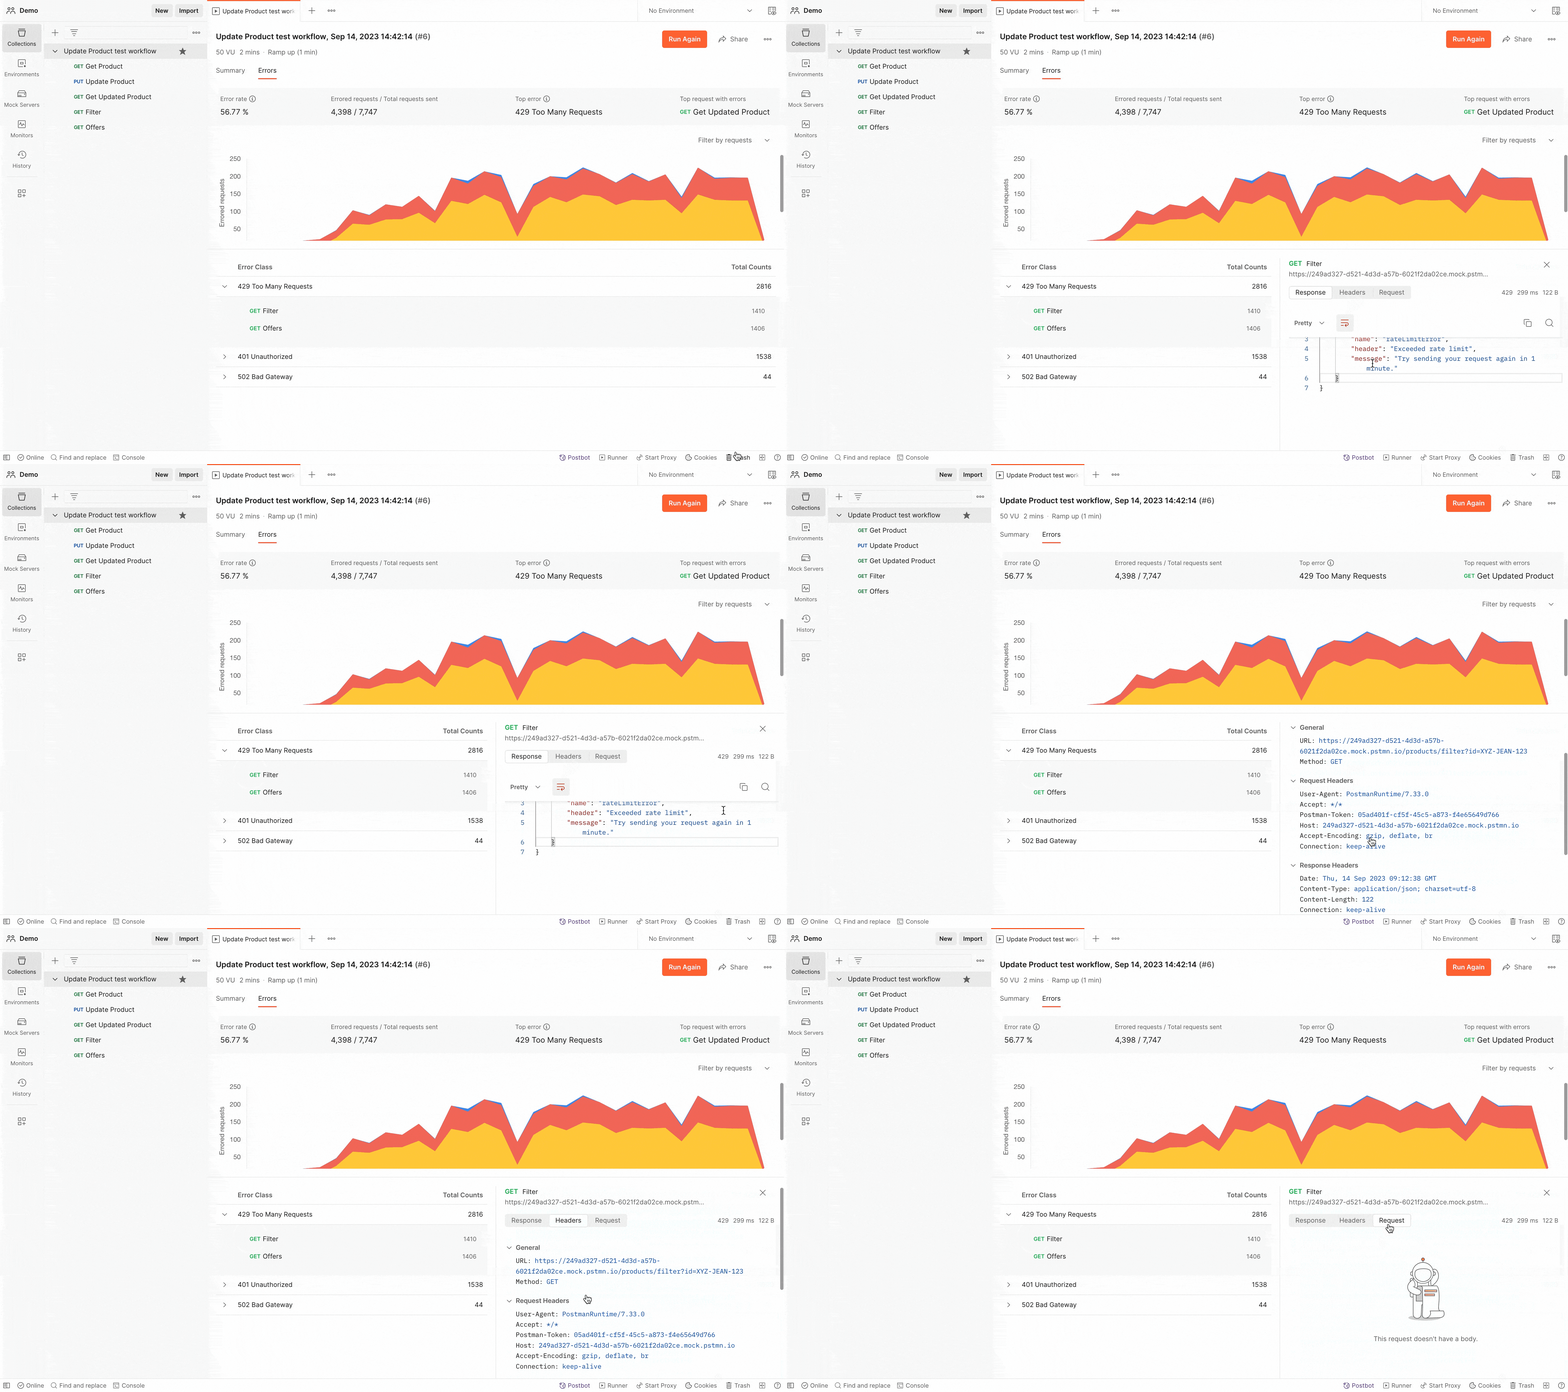
You can search on the response bodies or even copy these for faster use. Please note that the request headers, response headers, and bodies are only available during a given user session, and these values are not persisted in Postman.
We hope that with this new feature, you find it easier to test your API’s performance and troubleshoot any unexpected errors that might be slowing you down. Read more about error troubleshooting on your performance tests on our Learning Center here.
You can learn more about Postman’s API performance testing on our Learning Center here. We are providing up to 25 performance test runs for free on a monthly basis in our free plan. You can get even higher usage by upgrading to a paid plan.
Schedule time with a Postman product manager to learn more about this feature, and give us your feedback in a comment below.

I am getting Failed to run Postman encountered an error due to which the run could not be started. Please try again. this error. Need Solution
Please contact our support team at http://www.postman.com/support, and they’ll be able to help you.