
How to Track Every API Your Organization Owns with API Catalog

Ask most engineering leaders how many APIs their organization runs, and you’ll get an estimate, not an answer. Teams spin up services independently, specs live scattered across repos, test results sit in whichever CI tool a given team happens to adopt, and production health lives in a separate observability stack entirely. By the time an incident happens or an audit comes around, “who owns this API and is it actually healthy?” turns into a multi-team Slack thread instead of a five-second lookup.
That’s the exact gap API Catalog is built to close: a single, always-current view of every API and service your org owns – what exists, who owns it, how well-tested it is, whether it’s passing CI, and how it’s actually behaving in production. This walkthrough covers how to set it up and use it day to day.
What API Catalog actually aggregates
Before getting into setup, it’s worth being clear on what’s actually flowing into this single view. API Catalog pulls together four categories of signal per service:
- Ownership and discovery – what APIs exist, where they’re defined, and who’s responsible for them
- Spec quality – OpenAPI/AsyncAPI linting results and governance violations
- CI/CD status – pipeline runs from GitHub Actions, GitLab CI, or Jenkins, down to the PR level
- Production health – p95 latency, error rates, uptime, and request volume per endpoint
The point isn’t only visibility – it’s that these signals sit next to each other. A developer reviewing a service before integrating with it isn’t only looking at a static spec; they’re looking at that spec alongside how the API is actually behaving right now.
Step 1: Connect your source repositories
You don’t populate the Catalog by manually registering every API – it scans for them. Connect a GitHub (or GitLab/Jenkins-backed) repository to your Postman workspace, and Postman scans it and pulls in what it finds: API specifications, collections, and, if you’re running services in a Kubernetes cluster, the live endpoints themselves.
To do this:
- From Home, click API Catalog.
- Connect your Git provider and select the repositories you want scanned. (You’ll need the Admin role for this step, since it wires up the data flow from third-party connectors and repos.)
- Postman scans each connected repo and adds discovered APIs as entries in the Catalog automatically.
This is the piece that keeps the Catalog from rotting into another stale spreadsheet – new services get picked up as they’re pushed, not weeks later when someone remembers to log them.
Step 2: Map each API to its real-world environments
An API “working” means something different in staging than it does in production, and API Catalog keeps that distinction explicit through System Environments – letting you map the same API to each deployment context and see health data specific to that context, rather than one blended number.
To set this up:
- Open the API in the Catalog and go to Service Environments.
- Add an environment record for each deployment context (Staging, Production, Beta, etc.).
- Connect each environment to its relevant source:
- Staging typically connects to your CI/CD pipeline, showing the latest test pass rate and any spec violations introduced on the current branch.
- Production connects to your observability stack via the cluster watcher, surfacing live p95 latency, error rates, and uptime per endpoint.
Once this is wired up, switching between environments in the Catalog view shows you a genuinely different picture of the same API – which is usually exactly the picture a platform team needs before approving a change or debugging an incident.
Step 3: Read the health scorecard
Every service in the Catalog gets a Service Health Scorecard – a rollup of test results, spec compliance, and gateway metrics in one view. Instead of manually checking a monitor dashboard, a separate test report, and a spec linter for every service on a rotation, you open the service and the Catalog tells you.
To use it:
- Open a service in the Catalog.
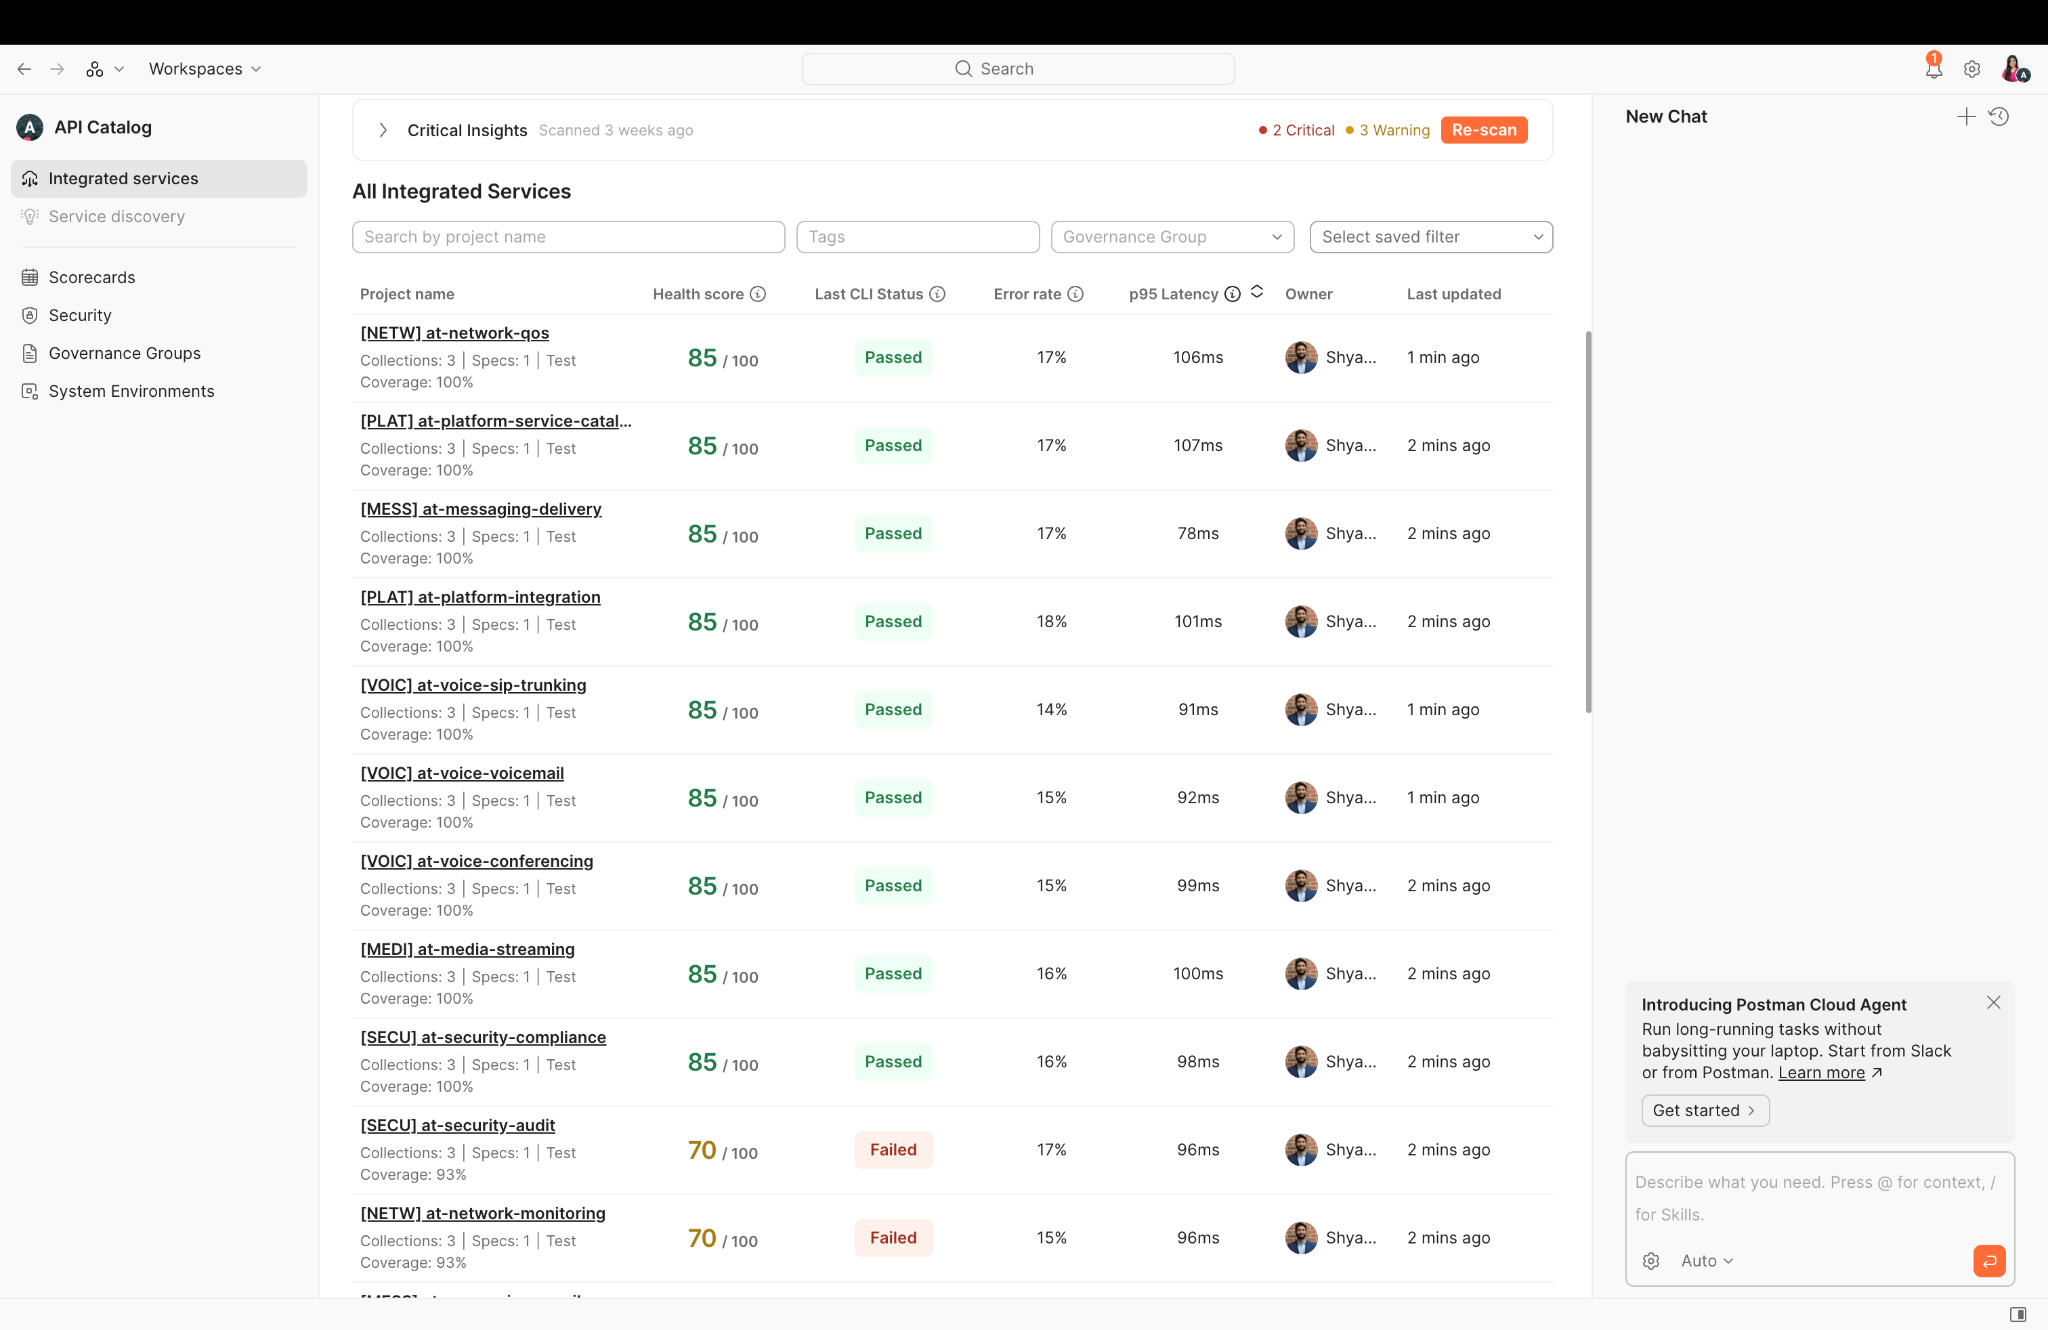
- Check the health scorecard section for a combined read on test pass rate, spec compliance score, and live gateway metrics.
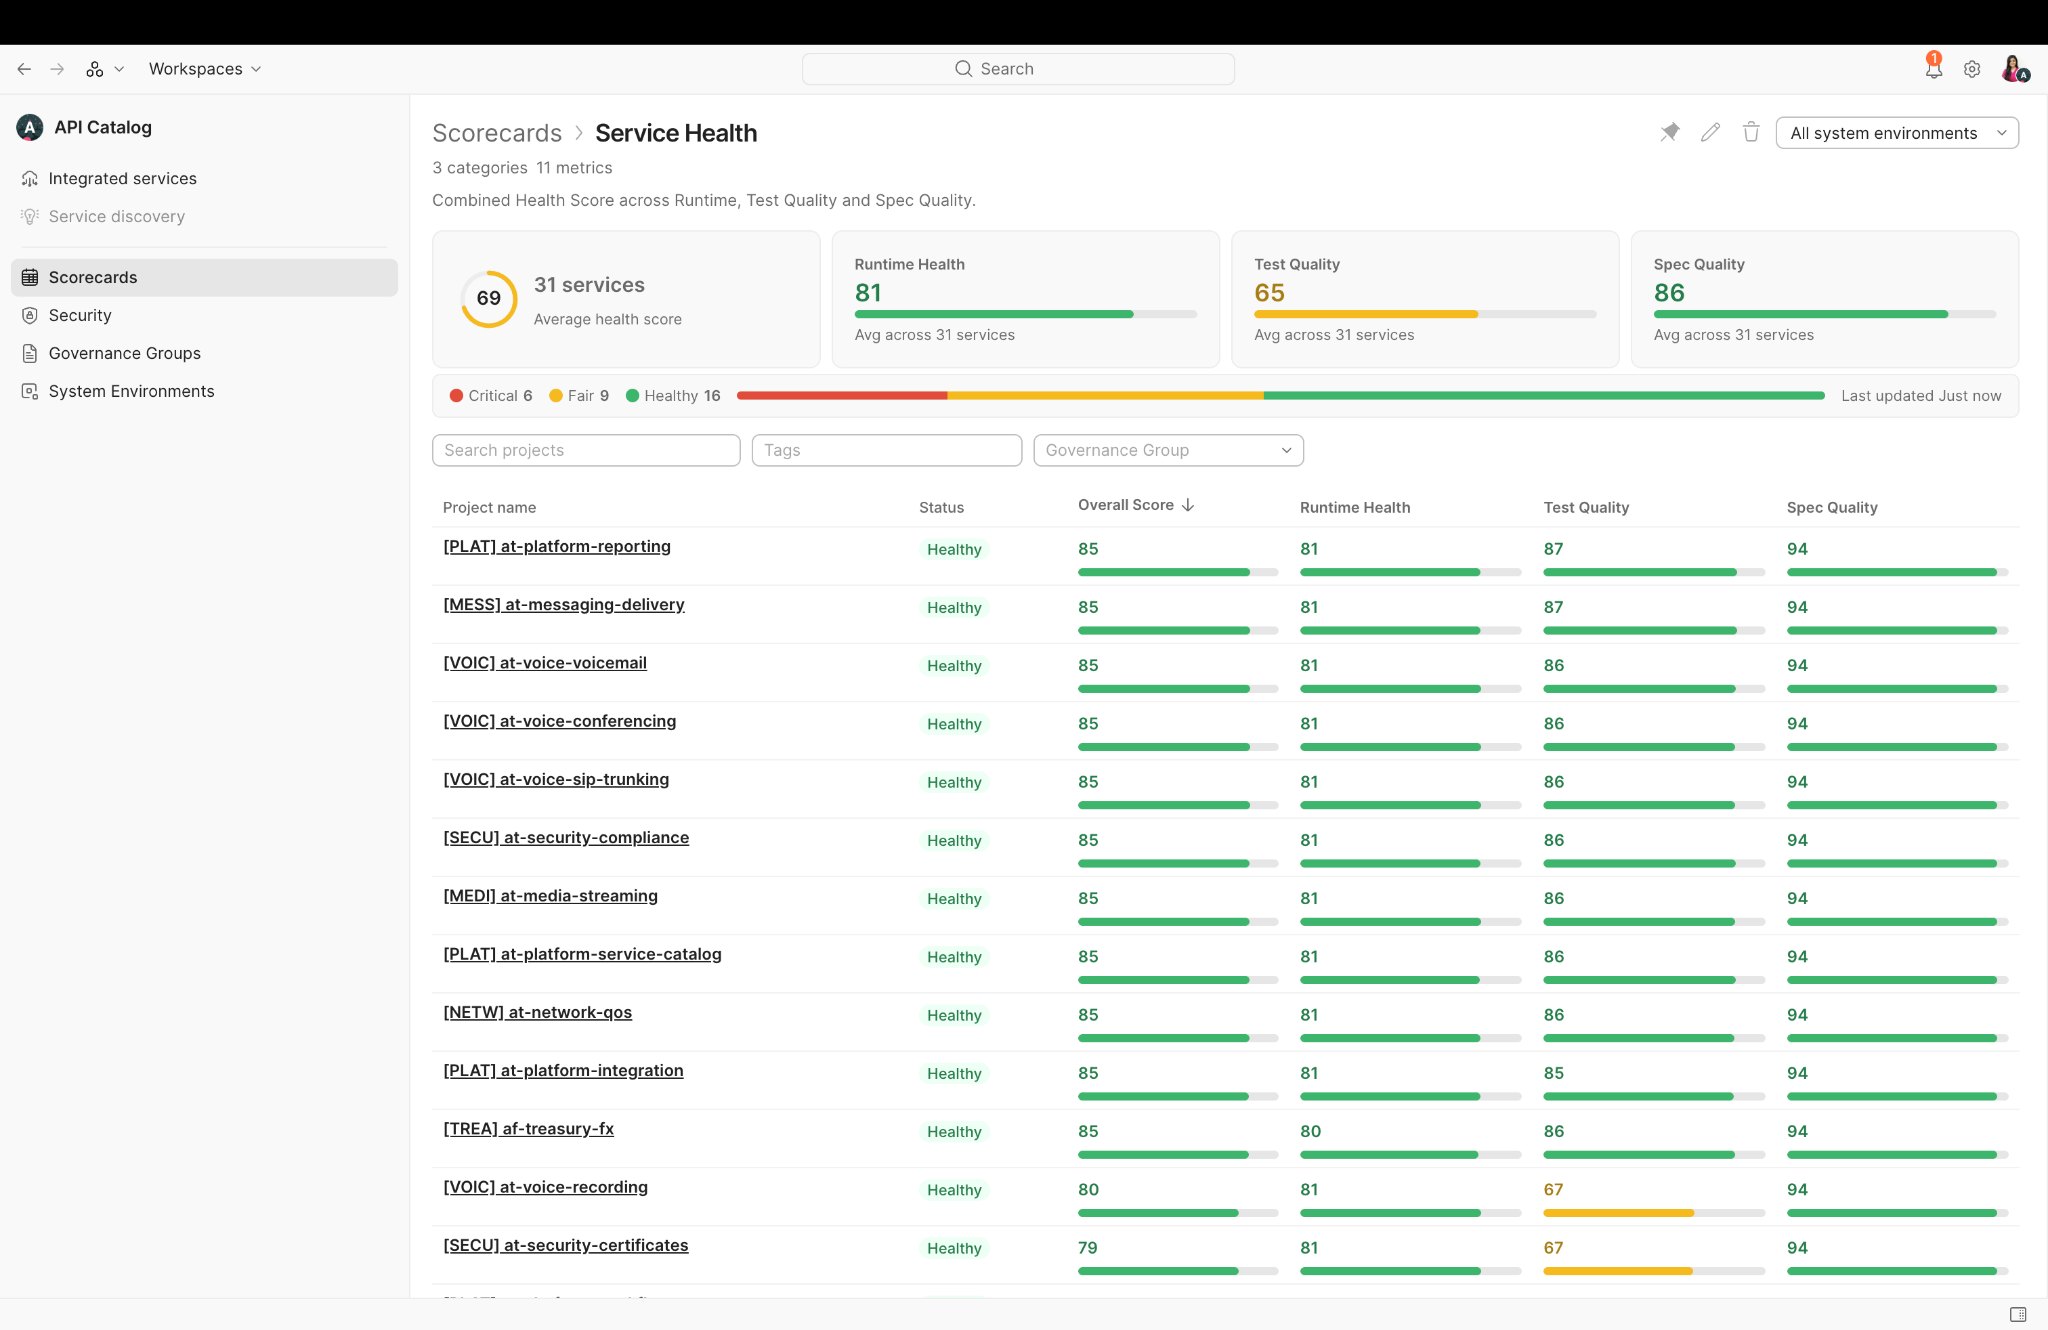
- Set thresholds per metric so a service is flagged as healthy, needs attention, or critical – rather than relying on someone to notice a slow decline.
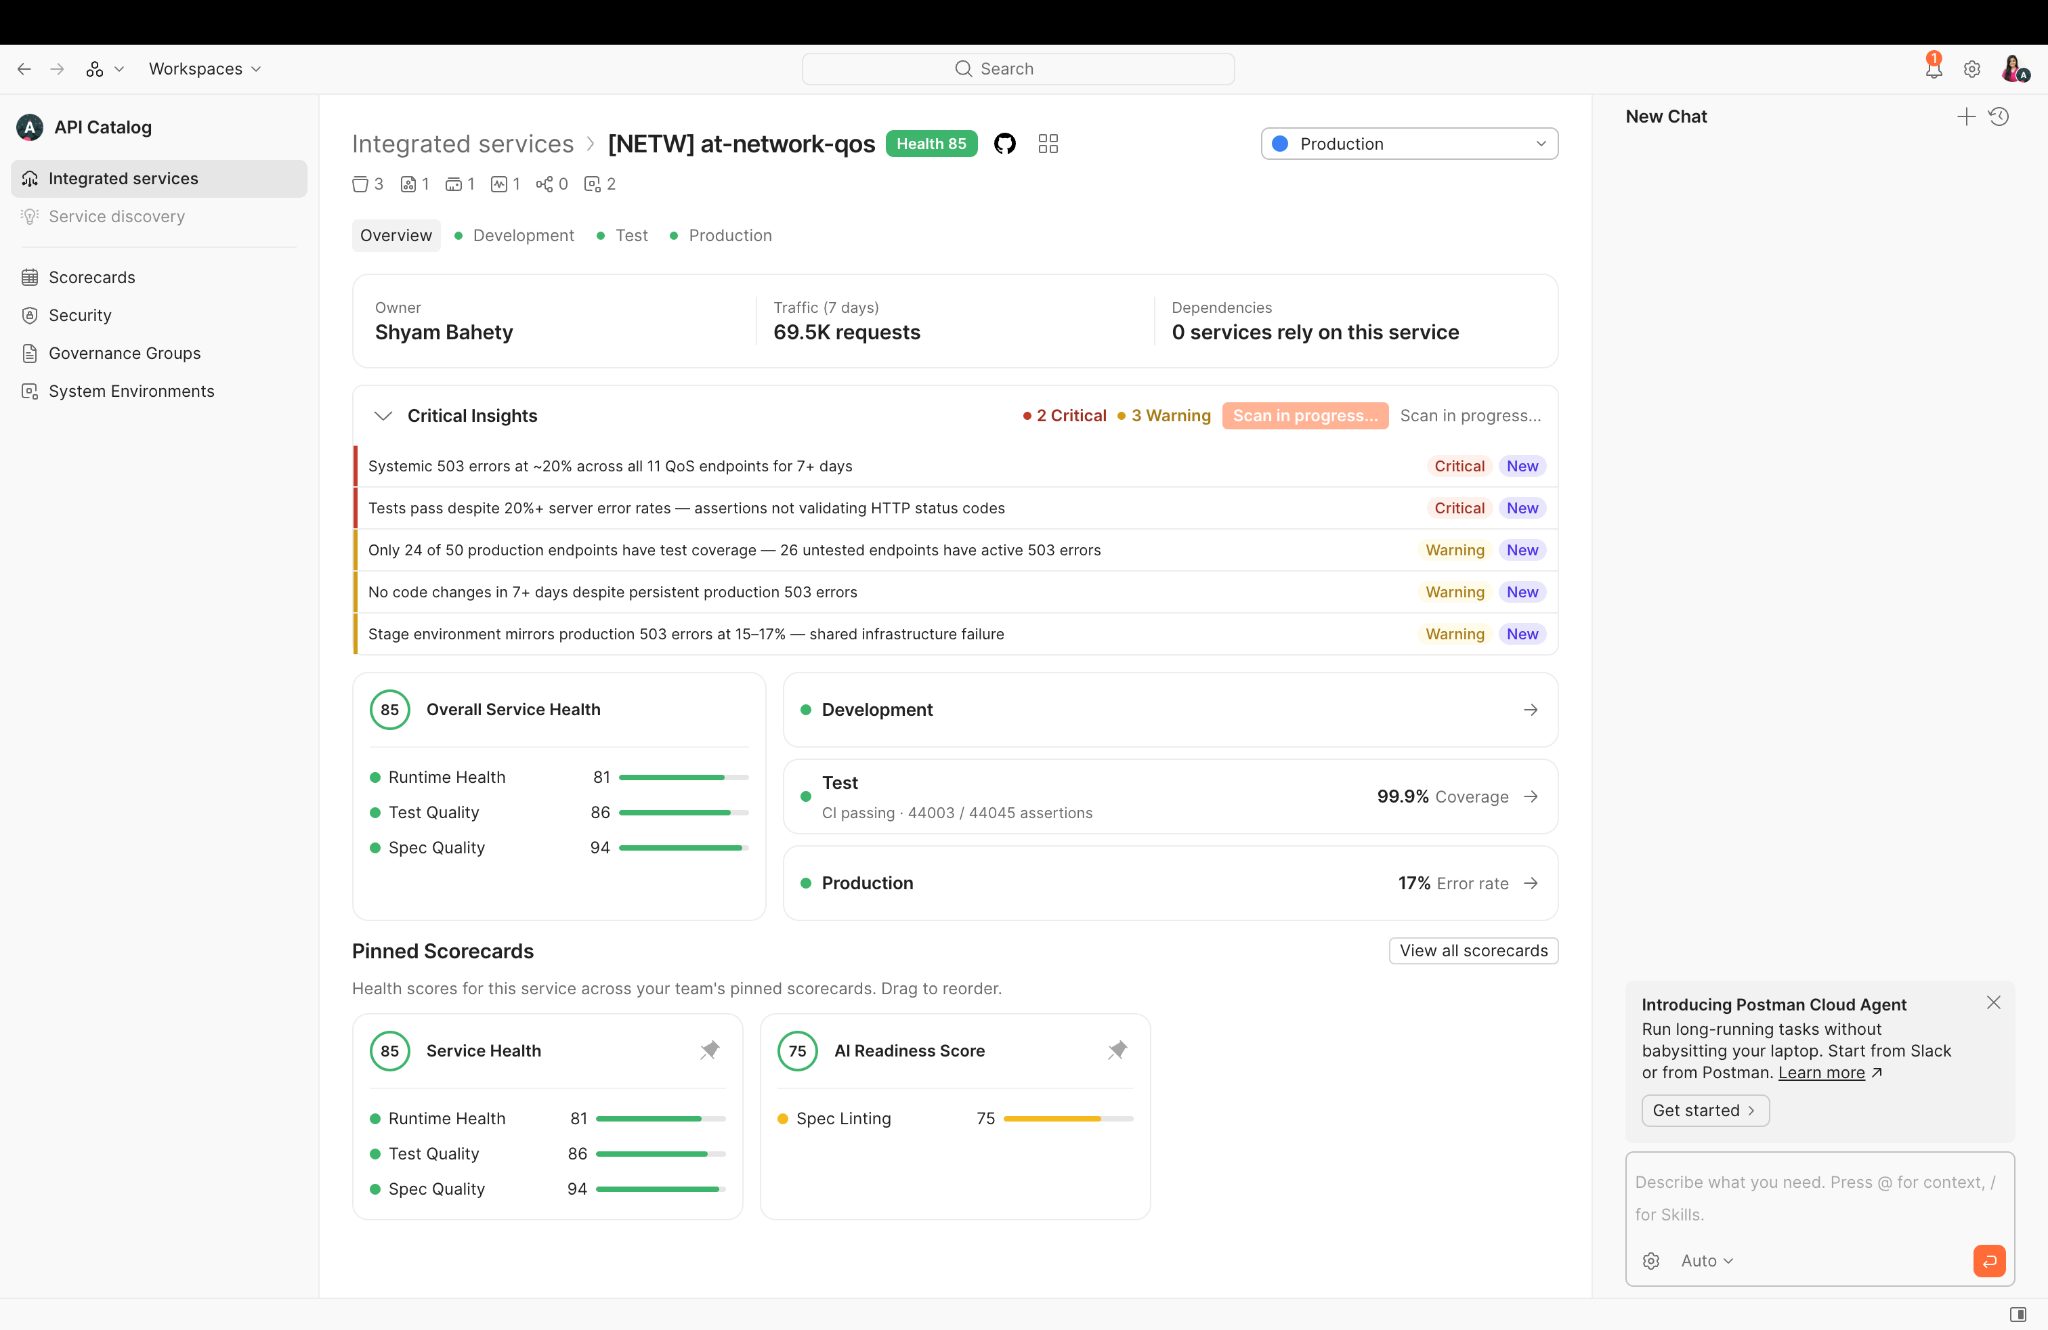
This is the piece that turns API governance from a weekly manual review cycle into something closer to real-time. If a service’s test pass rate drops or a new spec violation gets introduced, it shows up here immediately rather than at the next scheduled check.
Step 4: Query the Catalog with Agent Mode
Once data is flowing in, you don’t have to click through service by service to find what needs attention. Postman Agent Mode can query the Catalog directly using natural language – for example, asking which services have recently failed CI/CD tests, or which ones are returning errors in production.
A typical flow looks like this:
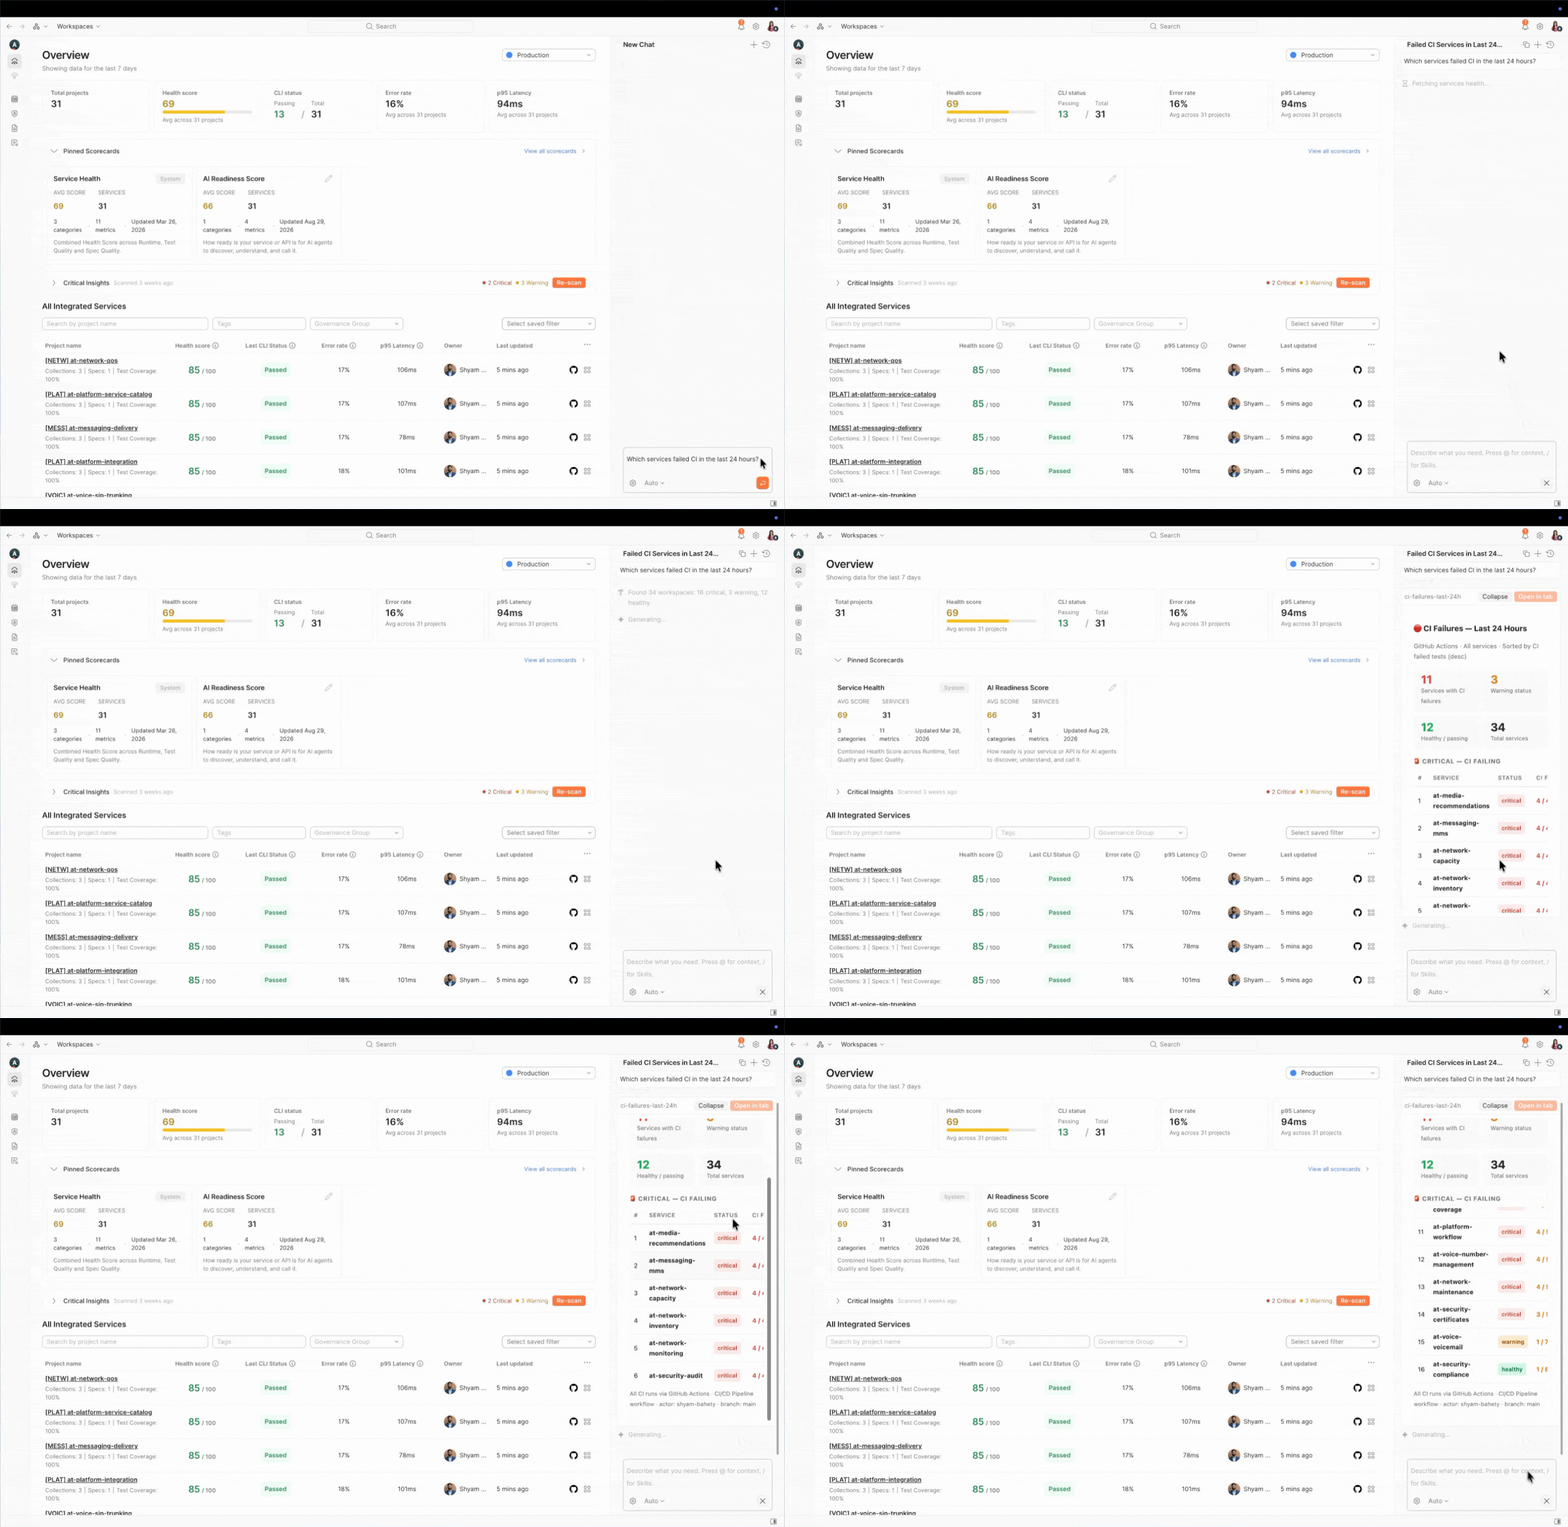
- Ask Agent Mode something like “Which services failed CI in the last 24 hours?”
- Agent Mode correlates the recent deployments and failures across the connected services.
- From there, you can instruct it to suggest – or directly implement – a fix, whether that’s correcting a spec issue, updating a failing test, or pushing a fix back to the repo via the Git integration.
This is where API Catalog stops being a dashboard you check and starts being a workflow you run through: surface the problem, diagnose it, and resolve it, without switching between four different tools to do it.
Why this matters for platform teams specifically
If you’re running an API governance program, the value here isn’t only dashboarding – it’s what it does to your review cycle. Identifying which APIs need attention today usually means someone manually cross-referencing monitor dashboards, test reports, and spec compliance results on a weekly cadence, with real issues sitting undetected in the gaps between reviews.
With API Catalog, that becomes: development activity, test results, and production signals sitting together in one place, updated continuously. Teams tend to use it as their source of truth for what APIs exist and who owns them in the first place – and once health data lives in that same view, service-level agreement conversations and service reviews stop requiring a round of “let me go check and get back to you.”
Get started
API Catalog is available on Postman Enterprise plans. If your org already has it, start with the Catalog overview in Postman Docs – it walks through registering APIs, connecting workspaces, and pulling in the signals the scorecard depends on. If you’re only running scheduled monitors today, you’ll still get baseline health data; connecting your CI pipeline and API gateway is what unlocks spec compliance and production signals in the same view.
See your organization’s full API landscape in one place. Explore API Catalog.









What do you think about this topic? Tell us in a comment below.