How to run a monitor with the Postman API
Postman Monitors provide continuous visibility into the health and performance of your APIs. Collection-based monitors let you run API test scripts, chain together multiple requests, and validate critical API flows. While you probably know that you can schedule monitors to run at specific intervals or manually run monitors, did you know that you can also run monitors using the Postman API? With the Postman API’s /monitors endpoints, you can integrate monitor runs in your workflows, such as CI/CD tooling, your API monitoring dashboards, or any other app that you use.
In this blog post, we’ll show you how to use the Postman API to run a monitor.
There are two ways you can run a monitor with the Postman API: using the monitors or webhook endpoints.
Monitors endpoints
You can use Postman API’s Monitors resource to create, read, update, and delete your monitor resources. You can use the Run a monitors endpoint to run the monitor synchronously and get information about the run.
This is a basic JavaScript example that shows how you can use the Run a monitors endpoint:
var myHeaders = new Headers();
myHeaders.append("X-API-Key", "");

var requestOptions = {
  method: 'POST',
  headers: myHeaders,
  redirect: 'follow'
};

fetch("https://api.getpostman.com/monitors/{{monitorId}}/run", requestOptions)
  .then(response => response.text())
  .then(result => console.log(result))
  .catch(error => console.log('error', error));
Webhooks endpoint
The Create a webhook endpoint allows you to trigger the run of a collection with a webhook. This is how it works:
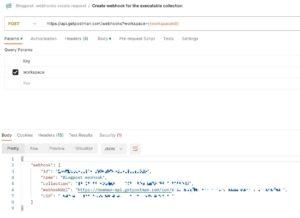
- Create a webhook with the
Create a webhookendpoint. The request body must contain the webhook’s name (webhookName) and the UID of the Postman Collection (collectionUid) you want to run. For example:{ "webhook":{ "name": "Blogpost webhook", "collection": "12345678-42717b5c-0b9c-11ee-be56-0242ac120002" } } - The request you send creates a monitor linked to the collection. The response returns the monitor’s name and its ID. The response also returns the
webhookUrlproperty:
- Important note: The
webhookUrlvalue contains sensitive information, so treat it like you would a password. Calls to the webhook’s URL do not require authentication. - A POST to the
webhookUrlruns the monitor and the collection.
The valid JSON body you post passes to the collection. You can get it with the following code in a pre-request script:
let previousRequest = JSON.parse(globals.previousRequest),
    webhookRequestData = previousRequest.data;

// webhookRequestData contains the data sent to your webhook.
console.log(JSON.stringify(webhookRequestData));
This pre-request script allows you to receive dynamic data and not depend on an environment.
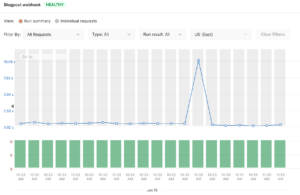
You can also check the webhook’s monitor runs with Postman Monitors:
Differences between monitors and webhooks endpoints
First, what’s the difference between using the monitors endpoint and the webhooks endpoint?
- With
webhooks, you don’t need an environment when you run a monitor. The collection gets information from the posted body and operates with that data. You can’t do this with a regular monitor. - No authorization is required when calling the webhook. If you run a monitor with the Postman API’s
monitorsendpoints, you need authentication. Rate limits also apply towebhooksandmonitorscalls. - If you need information about a monitor’s run, then you’ll need to use the
monitorsendpoints. This is because the webhook call doesn’t return that information—it only triggers the run. - You can’t create, read, update, or delete a webhook. However, you can do so with monitors using the Postman API.
So when should you use webhooks instead of monitors endpoints?
If you want to run a complex collection that requires dynamic parameters, then using webhooks is the solution. You can set collection variables based on the previousRequest posted data and have different behavior based on that, which makes webhooks very powerful.
Using a GitHub action to run a monitor with the Postman API
We’ve integrated a request to the Run a monitor endpoint into a GitHub action. You can use this action in your repository to run a monitor when a specific GitHub event occurs and check the run’s results.
Before getting started, you’ll need the following:
- A GitHub repository
- A valid Postman API key
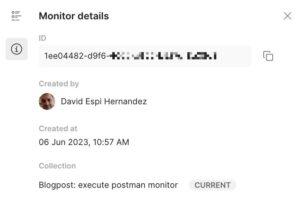
- The monitor’s ID. To get it, find your monitor, then click on the information icon and copy the ID as show below:
Use the GitHub action
The GitHub action code is available in the execute-postman-monitor repository. The following is an example of the action’s trigger on a pull request called Execute Postman Monitor:
name: Execute Postman Monitor
on:
  pull_request:
jobs:
  execute-postman-monitor:
    runs-on: ubuntu-latest
    steps:
      - name: Execute Postman Monitor
        id: executeMonitor
        uses: postmanlabs/execute-postman-monitor@v1
        with:
          postman-api-key: ${{ secrets.POSTMAN_API_KEY }}
          monitor-id: ${{ vars.MONITOR_ID }}
In this example, the action runs when a pull request is created. It also reads the parameters it needs from the repository’s secrets and variables.
Now that we have what we need, let’s configure and run the GitHub action.
1. Configure your GitHub repository
Make the following configuration changes to your GitHub repository:
Create the workflow
You’ll need to first create the workflow. Give this file a meaningful name so it makes it easy to see what it does. For this tutorial, we’ll use the execute-postman.monitor.yml file name.
In your GitHub repository, create the execute-postman.monitor.yml file in the .github/workflows folder. If the .github/workflows folder does not exist, you’ll need to create it, then add the file to this folder.
You can also create the workflow in the GitHub Actions tab. Select New workflow, then Configure in Simple workflow. Update the file name and the GitHub action code.
Set up environment variables
In the GitHub repository’s Settings > Secrets and variables > Actions tab:
- In Variables, create the
MONITOR_IDrepository variable and add the Postman Monitor’s ID. - In Secrets, create a
POSTMAN_API_KEYrepository secret. This contains a valid Postman API key.
When you’re finished, commit these changes to your repository.
2. Run the GitHub action
After you configure the action, the action automatically runs when a pull request is created on the repository:
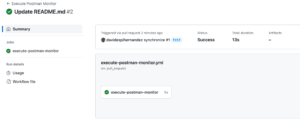
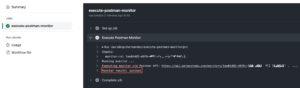
You can check the monitor’s results (success or failed) in the logs:
Additionally, this action sets a status output variable when it completes that other actions in the workflow can use.
This action is not intended to fail unless the monitor can’t run. Even if the monitor returns a failed result, this GitHub action won’t fail.
Next steps
This is a basic action that uses a Postman API call on an existing Postman Monitor. However, you can take this a step further and dynamically create a monitor, run it, then delete the monitor—all with Postman’s Monitor APIs.
Summary
This is just one of the ways you can use the power of the Postman API to help you automate your software development process. Explore our Postman API documentation and let us know in a comment below if you discover any other great ways to automate your workflows with the Postman API!

What do you think about this topic? Tell us in a comment below.