
How Postman Does Data Democratization
The world has more data than we know what to do with. As of 2020, the globally generated data volume has reached 40 zettabytes (i.e., 40 billion terabytes). Add to that massive volume the fact that data has also, in recent years, come to be seen as an immensely valuable currency. The miners of this voluminous currency (data engineers, analysts, and scientists) are thus scrambling to build a range of new tools every day to extract knowledge and insights out of this valuable raw data. As a result of that wide range of tools (with new ones arriving all the time), deriving insights from data is becoming an increasingly siloed practice because everyone is using different tools.
Going a step further, decision-makers in every organization have to consume the parsed knowledge, understand it, and make decisions quickly. As the complexity of this process increases over time, decision-making becomes harder and harder. The complexity here comes in various flavors:
- Sheer volume of data
- Diversity of business rules
- Interpretation across various business/product domains
- Making collaborative decisions across business/product domains
Today, nearly any knowledge worker theoretically has the ability to make better decisions because they have so much data. But the data complexities listed above can make it difficult to put this theory into practice.
An initial thought-exercise
Before going ahead, let’s think about a real-world scenario where the following things are happening related to data:
- Decision-making within the organization is moving from a few leaders to all knowledge workers
- One way to look at it is rather than falling on CXOs for making decisions (which might be good at an early stage but not scalable), more and more people in the organization are making decisions
- There is a 10% rate of increase in decision-makers month-over-month
- Increasing popularity of your organization/product/platform is resulting in more and more users onboarding i.e., data size is increasing at 10% rate month-over-month (a decent rate)
Assuming the above scenario with a current data team of 5-10 members inside a company that is growing very rapidly, a basic question arises: How do you scale?
One solution would be to just scale up the team and scale systems vertically (increasing storage, compute and network). To be honest, this is not a bad solution at all. But can we keep scaling vertically (both the team and the systems) every time we see an increase in any of the above (number of decision-makers or size of data)? At some point of expansion, the solution doesn’t look scalable at all.
In addition, scaling this way might result in knowledge silos where the information is available to limited people including the data team and the corresponding decision-maker(s).
To get some perspective around the level of scaling required, a 10%-per-month increase in data volume amounts to a 10x increase in two years. Does that mean that our team of 5-10 people will need to become 50-100 people? Hopefully not, and let’s look at how our team at Postman has avoided that scenario.
A brief history of Postman’s data team
In the earlier stages of Postman, we started with a siloed data team (consisting of a data engineer and a data scientist) which was catering to the data/knowledge needs of the whole organization. This team grew over time as the organization scaled. One key insight is that the data team scaled sub-linearly even though the data consumption needs grew exponentially.
How did that happen? We had a hypothesis that the data consumers were the right people determining their data needs and would appreciate the fact that they were autonomous and not dependent on a siloed, central team. From a system standpoint, this central team can result in a single point of failure and delays when acquiring data or generating insights to make decisions.
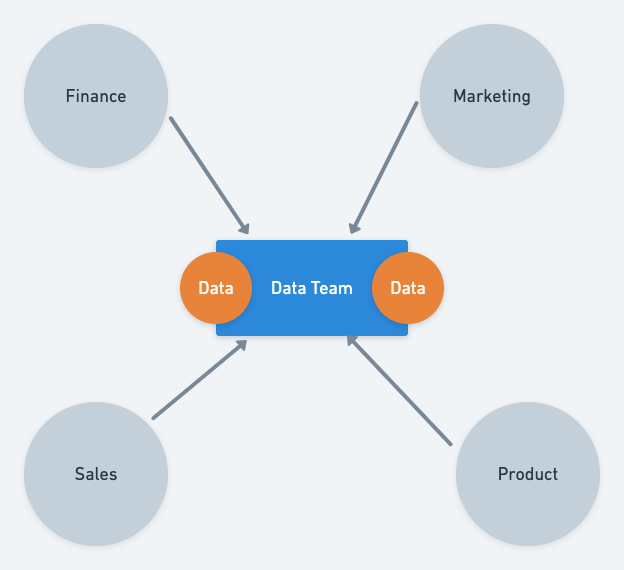
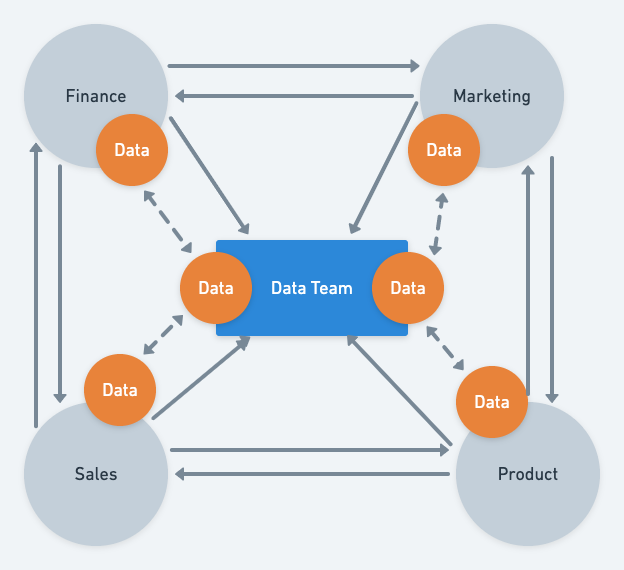
We call it democratizing the data at Postman. The idea is pretty simple: Democratization helps you build a decentralized decision-making system that can scale really well. However, democratizing something (including data) is easier said than done. The following picture illustrates a centralized versus democratized data system:
Our goal is data affinity and maturity
Before diving deeper into the democratization of data, let’s have a brief discussion around what kind of data maturity and needs there are in an organization.
There are two lenses to use for understanding data affinity and maturity:
- Data team lens: What are the fundamental hierarchical needs of data?
- Consumer lens: What is the lifecycle of problem-solving with data?
Understanding these two lenses helps us evaluate the fundamental needs of data at an organization along with consumer needs, to better work with data on a daily basis. Evaluating and observing the data maturity level of the organization also gives us a powerful tool to understand the impact of a data team on the overall organization.
Let’s take a deeper look at each of these lenses.
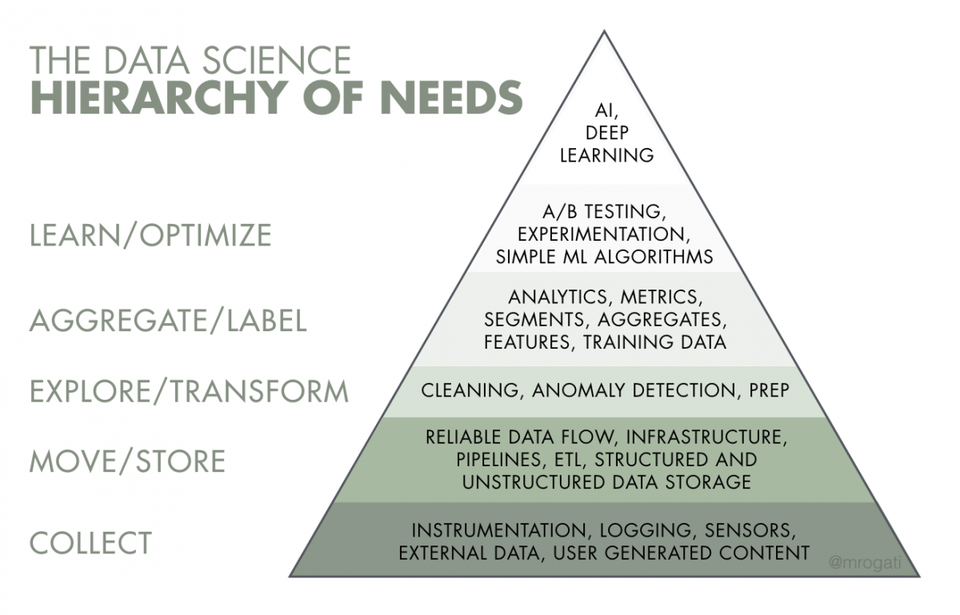
The hierarchy of needs of data
The following figure—reflecting the idea of Maslow’s hierarchy of needs—depicts the maturity level of data in any organization where the fundamental need is to collect data and the top-level need is self-realization using data (i.e., artificial intelligence or deep learning).
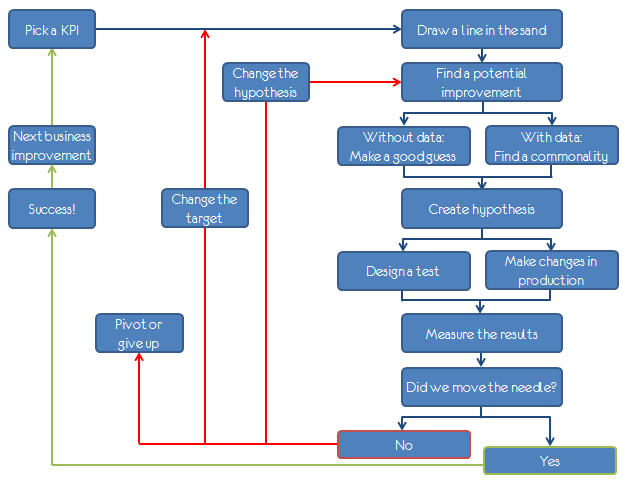
The lifecycle of problem-solving with data
Leveraging concepts from Alistair Croll’s The Lean Analytics Cycle, problem-solving can be converted into the following diagram:
Postman data team’s mission
By looking at data through these lenses, we have come up with our team’s mission: We enable (rather than service) the Postman organization to confidently make data-driven decisions with an analytical and iterative mindset.
This mission internally translates into the values that our team personifies on a daily basis where we try to enable as many people as possible to make decisions independently.
The fundamentals of data democratization
Now that we know what our aim is, let’s have a look at the framework and basic implementation of the democratization solution that we are using at Postman.
In order to democratize something, one has to make sure that a few key ingredients are available:
- Leadership buy-in to advocate the idea
- Inspiration for everyone to leverage data in their day-to-day decision making
- Guidelines of what it means and what it does NOT mean (i.e., codifying the platform)
- For data team members: Ability to measure that we are driving the right behaviors and make sure that we are improving over time
Fortunately for us, Postman’s culture drove the idea of curiosity and ownership. This helped us drive the initiative of democratization and fuelled the growth of everyone adopting data-drivenness.
Inspiration
While we keep true to our vision of democratization, it is still the data team’s responsibility to make sure that as an organization, Postman is getting better at making data-driven decisions. For this to happen, we did not want to follow the mechanism of working from shadows.
Hence, we introduced an analytical board for the whole organization to work with us on certain analytical questions and projects. The idea is to ensure the following:
- We encourage decision-makers working with data to ask the right questions:
- What kind of hypothesis would you like to validate with data? (e.g. Are users adopting a feature X over time?)
- What kind of decision are you planning to take using this data?
- Which objective and key results (OKRs) would this decision map to?
- We help showcase the value of data-driven decision making to inspire everyone around us
This analytical board is not only a gateway to the analytical world at Postman, but it also powers up the following:
- Raising a data acquisition request from data sources
- Raising a bug related to data on the data team
Creating the Postman data-democratization platform
In order to make the decision making as streamlined and decentralized as possible, we learned from industry experts, such as the Kimball Group, about how to model the raw and transformed data and adopt the platform mindset for the whole team. This mindset further graduated into the following platforms:
- Data integration as a platform
- An integration to acquire data should be as seamless as possible (with the proper review gates including security checks)
- The outcome of an integration (i.e., raw data should be accessible to everyone in the organization)
- Data transformation as a platform
- Anyone can transform the data to cater to their needs based on the guidelines
- Data visualization as a platform with the following capabilities:
- Measure to ensure we are on the right track
- Forecast to ensure we will reach our goal
- Experiment to play around with the measured data to reach the intended goal
- Data knowledge repository
- To learn from each other’s successes and mistakes
These platforms unlocked the potential of the whole organization to make decisions with confidence every day.
Why we chose Kimball modeling
With multiple ways to structure a data warehouse, why did we choose Kimball modeling? We chose Kimball modeling for our platform in order to mimic our organizational model (more details on this in the next section). The idea was to distribute the ownership of various data entities at Postman to their respective teams and to democratize report building or analysis on top of those entities.
This decision made sure that our data consumers are not siloed and there is a clear distinction of accountability based on the organizational structure.
Ownership framework
To further complement these platforms, we took a major decision around distributing the ownership of underlying data to various teams in the organization, hence creating a knowledge flow.
An interesting side effect of this mechanism is accountability for what a contributor has built (i.e., a dashboard on a pre-defined/owned dataset). The ownership can fall into either of these two buckets: a dashboard or a dataset.
Defining ownership on a dashboard is fairly easy. The team which creates the dashboard becomes the owner and the logical boundary on our platform (i.e., a folder of dashboards) ensures that. Ownership on a dataset is more difficult.
How do you define ownership of a dataset?
Since we are highly inspired by designing APIs, we believe that the ownership definition can be easily created by using a domain-driven design of teams, where every team owns:
- A domain in which products are built to cater to end users
- Entities in a domain which creates an accountability definition such as Postman Collection is in X domain
- Going one level further, APIs are defined and maintained by the corresponding team
Emphasizing the second point above, we were able to distribute ownership based on our organizational structure. This turned out to be a consistent definition where we walk and talk the same language, whether we’re building products or doing analysis.
Why we made certain technological choices
Let’s have a look at a few of the technical choices that we took to ensure the success of the platform:
- ELT (extract, load, and transform) rather than ETL (extract, transform, and load) for data integrations
- This helped us ensure that the transformations are taken up once the raw data is available, hence the context of business logic around transformations is not lost during the integration
- Since raw data is available for everyone, they can build their own transformations if and when required
- DBT (Data Build Tool) as a transformation engine
- From a platform standpoint, we encouraged everyone to contribute to business logic transformations on a centralized DBT, hence encouraging an org-wide contribution
- Looker as a data modeling and visualization platform
- Looker provided us a way to disseminate knowledge with various teams in the organization
- One key advantage of Looker is an abstraction layer (i.e., models) on top of warehouse tables that help us maintain consistent communication throughout the organization
These decisions helped us scale the aforementioned platforms with a few underlying philosophies:
How we measure
Since our name is the data team, we take pride in being data-driven ourselves. In addition to objectives and key results (OKRs) to drive intra-team behaviors, we also track our platform metrics—ranging from usage patterns to quality and performance.
The underlying mindset is to treat our platform as a product offering to data consumers within our organization. Hence we are all about acquisition, activation, and retention of users coming to our platform. In order to provide a great user experience, we use quality (based on bugs) and performance (based on rendering visualizations) metrics to evaluate ourselves.
Because our objectives and key results are primarily focused on the above metrics, we aim to provide out-of-the-box forecasting capability on our platform—and the way to measure success is to see the adoption of that feature. This mindset helps us solve some of the larger challenges at Postman while enabling the rest of the organization to leverage these features as tools, rather than having to reinvent the wheel.
A final thought-exercise
Based on what we discussed above, let’s see how our answers to the same questions change when it comes to scaling.
To revise what we talked about, we were looking at how one would scale a data team when there is an increase in decision-makers asking for analytical help and/or data at a 10% rate of increase month-over-month?
Using the democratization framework, we have distributed a substantial amount of analytical work with full autonomy so that we may not need to scale the team linearly anymore. However, we still need to become the advocate of an analytical mindset, so a sublinear scaling—such as one added member per 10-20 decision-makers—would be a good choice after all.
About knowledge silos, the underlying platform (which in our case is Looker) ensures that the knowledge is accessible to everyone with clear accountability and structure. And what’s even better is the fact that the knowledge/data structure mimics the organization’s communication structure— displaying Conway’s law in action.
From the standpoint of data size increase, since a lot of team bandwidth is available for us to scale up our infrastructure and make our platform easy to contribute to, we do the following things:
- Understand the lifecycle of data to archive/expire data when it is not required anymore
- Write modules/utilities to measure the quality of code by contributors to the platform so that we support efficient code writing (i.e., optimized SQL queries)
- And so much more; stay tuned as we continue sharing our learnings
Conclusion
By adopting democratization fundamentals, we’ve been able to successfully scale Postman’s data-driven practices across the organization. Still, we have a long way to go, and that motivates us to keep iterating our myriad processes to keep up with the current data world we live in—and to be prepared for what the future holds.
Does this topic interest you? If so, you might also be interested in working at Postman. Learn about joining the Postman team here.

Very insightful. I especially liked the concept of Analytical Board from the org and governance standpoint.
Would like to know more about how you are enabling the data scientists across your org to run their e2e ML pipeline – model building, experiment and evaluation, production deployment and maintenance using your data platform.
We are majorly using 2 models for that. One with the central Data Team and another with an embedded team member (ref: https://www.linkedin.com/posts/shubhambhargav_how-it-works-the-postman-data-teams-hub-and-spoke-activity-6702773186985119744–Ltx)
Model 1: Central team builds ML models as products. For example, we are building a forecasting model which is directly accessible for data consumers in the visualization tools i.e. forecasting is just one click away. There are certain nuances with this approach. We are planning to write about this in the following months.
Model 2: Embedded team member builds a ML model and the central team provides them with a platform to run it. There are certain constraints here such as the model should be accessible by an API. This ensures that we can re-use it in a diversified set of workflows in the organization. One such example is a recommendation engine. We are still trying to figure out the feasibility of making this mechanism generic enough so that recommendation engine becomes a platform with minor modifications for each business use-case i.e. an extensible platform.