Inspecting Postman Requests
There are a number of options that Postman provides to create your HTTP requests. Even so, there may be situations where you want to inspect the exact request and response payloads, to make sure that Postman isn’t causing your API call to fail.
Viewing the exact HTTP request and response is not straightforward. You’ll first need to enable the Chrome DevTools for Postman. DevTools are a set of extensive debugging tools built into Chrome. Check our blog post for instructions on how to do this.
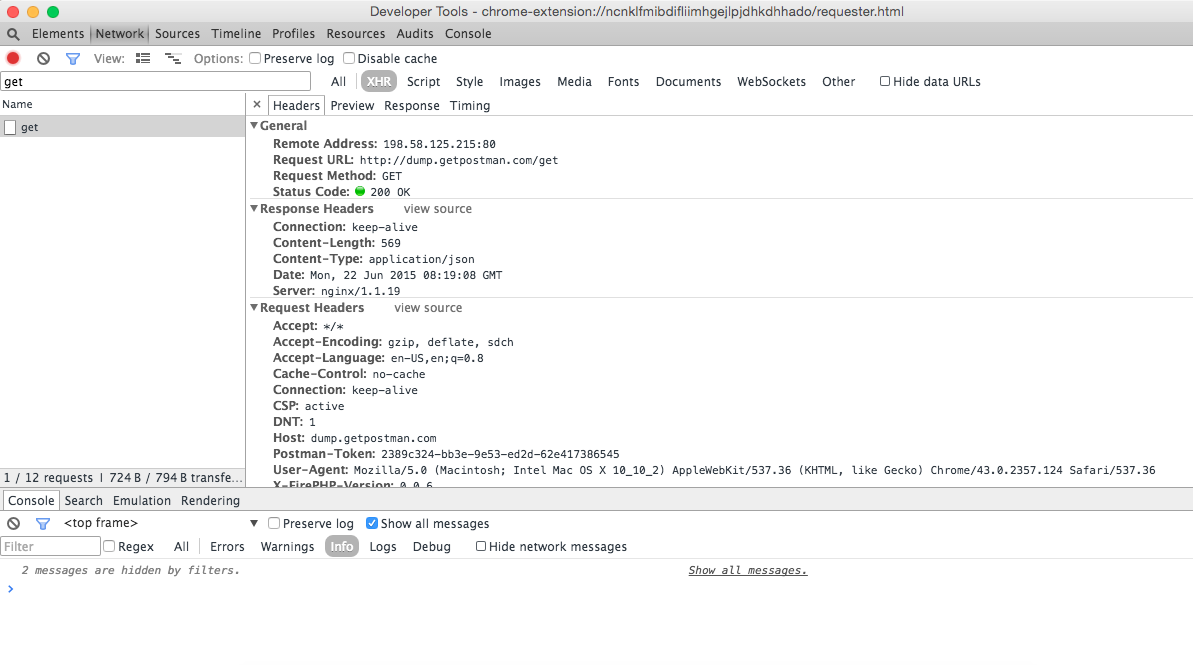
Postman’s Developer Tools window:

Once you have DevTools enabled and opened, you’re good to go. There are 3 ways you can make requests in Postman:
- Using the request builder
- Using the collection runner
- Using Postman with the Interceptor enabled
Using the request builder
If you are making requests from the main Postman window with the Interceptor disabled, read on. You can right click on the main Postman window > Inspect element. In the Network tab, you’ll be able to see the request when you click the Send button. Clicking on the request in the Network tab will show you the response payload.
Using the collection runner
If you are using the collection runner to run entire collections, you’ll need to open DevTools for the Collection Runner, not the main window. You can right click on the Collection Runner window > Inspect element. In the Network tab, you’ll be able to see each request made when you start the collection run. Clicking on the request in the Network tab will show you the response payload.
Sending requests with the Interceptor enabled
Postman, being a Chrome application, has certain restrictions. For example, you cannot set Cookies while making a request. There’s a companion extension called the Postman Interceptor that acts as a middleman and lets you add cookies from within Postman! When the Interceptor is enabled, the actual HTTP request is made from the Interceptor, and not from Postman.
You can head to chrome://extensions, enable ‘Developer Mode’, and search for the Interceptor. Click the “Inspect views: background.html” link to open DevTools. You should see the requests and responses in the Interceptor’s DevTools window when you make requests through Postman.

Very helpful thanks!
for some reason this is not working for me – I followed all the instructions and enabled the dev tools – but when I run the collection runner – i see no traffic in network tab in dev tools. I am on windows OS – running v4.7.1
it’s a very handy function~
What’s up, after reading this amazing article i am too delighted to share my
familiarity here with friends.
Hi! This post could not be written any better!
Reading this post reminds me of my previous room mate!
He always kept chatting about this. I will forward this article to him.
Fairly certain he will have a good read. Thanks for sharing!
I am regular visitor, how are you everybody? This piece of
writing posted at this web site is really good.
Really helpful.
Tried to enable DevTools, but it seems that it’s not currently possible in Postman. I followed the instructions at the other article and posted more details in the comment section there.
Not clear if you are talking about the Chrome version (seems to be, but this is depreciated apparently) or the Desktop version. Can you clarify please?
I am reading this blog and not able to right click in the Postman window to Inspect Element. Is this still how it works?
Ah this is for the Browser version of Postman only. For the Client, there is a Console button at the bottom of the screen that displays this information.
Is this post still relevant? Also some requests I can only make from desktop client 🙁