Postman Now Returns Network Information for Each API Request
There are a lot of things that can go wrong when making an API request, so being able to see all of the details for each request and its resulting response enables developers to troubleshoot. Postman is dedicated to helping developers debug and understand what is happening within each API request—and that’s why with the release of Postman v7.27, users can now view a wealth of new information about the underlying network connection involved with each API request being made.
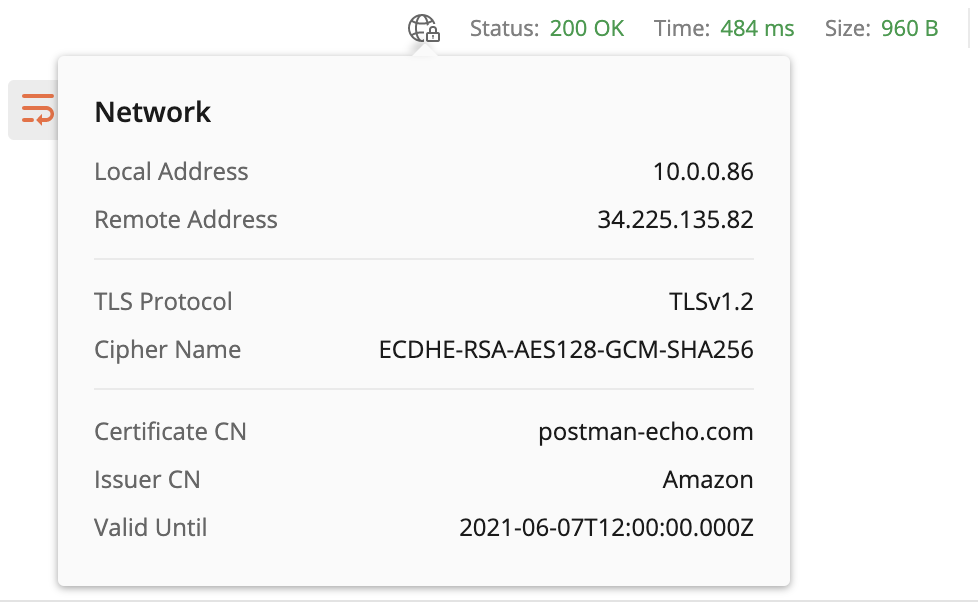
Here’s what is now returned with each response in Postman: In addition to seeing the body, cookies, headers, status code, time, and size of each API response, you also now have a network information icon that will give you the IP address, transport layer security (TLS), and certificate details for the network connection used to make the API request:

Postman’s network information icon gives a breakdown of the network elements and delivers more precise and informative error details when something goes wrong. This gives more visibility into each response, providing developers more of what they need to make sense of each step of the API supply chain—from API client to the server, and back again.
One of the most common areas of friction introduced by the network layer of API operations involves SSL certificates. Developers have repeatedly told us that they don’t have visibility into what is going wrong when it comes to encryption, and Postman helps minimize roadblocks by now providing the technical details of each certificate involved, including certificate owner, issuer, and expiration, as well as the technical details of the TLS protocol and cipher. The information returned with each API response in Postman has become more actionable, giving developers better control with a more complete understanding of the network, server, and other components of the API supply chain.
Postman’s road map is a reflection of what our users are facing: When developers voice their biggest challenges, we’ll dig deeper into the technical details of what is going on in order to provide greater insight and tooling for troubleshooting. The introduction of the network information icon is Postman’s response to direct feedback we received from developers via open GitHub issues submitted to us, and through our community page.
As we continue to support more than 17 million developers building internal, partner, and public APIs, the network information icon is just one more way the Postman API Platform is pulling back the curtain on what is happening behind the scenes of the web, mobile, and device applications we work with each day.

Hi, is there a way to test this network information? I want to check the expiry date of the Certificates.
Hello, I must admit that I’m also trying to test this network section.
Every forum I found related to this question has no answer, should I consider that there is no way to read this network section in order to write tests ?
Thanks
This is sort of helpful… but… what’s the benefit of showing us the internal (RFC 1918 non-routable) address such as 10.0.0.86 as in your example illustration? I don’t know if it’s even doable to give us the translated external IP address the Postman requests are issuing from, but that alone could be of use (e.g. it’s what shows up in our server logs as the remote/requestor address.)