Postman’s New Collection Runner
We built the Runner initially for automated testing of your APIs, so that you could, quite literally, sit back and watch your API test itself. Over time though, people have started using the Runner extensively, using it for load & stability testing, among other things. This prompted us to rethink the Runner from scratch.
Welcome the Collection Runner 2.0. The new Runner is out on our Canary channel now, and will hit our stable builds in late November.
When we designed the new Runner, the primary goal we had in mind was flexibility. The Runner needed to allow debugging of complex runs, while not being too intimidating for simple runs. The design of the new Runner is focussed on treating a run as a debug session between you and your API, while still maintaining a level of automation.
The new Runner is built on Postman Runtime, which means it brings with it everything the Runtime has to offer. This means parallel runs, faster execution of test code, and a more secure NodeJS based sandbox for running pre-request and test scripts, and many other improvements.
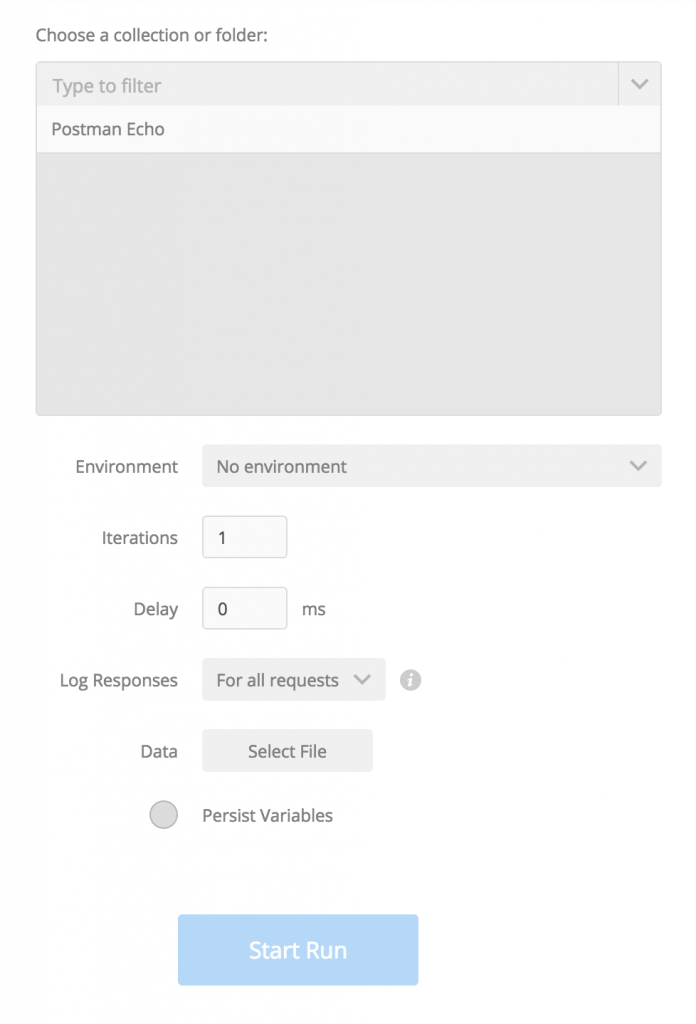
Let’s take a little tour of the new Runner. Opening it up, we see a familiar panel to the left, which is our run parameter selector. Everything here is the borrowed from the previous iteration of the Runner.
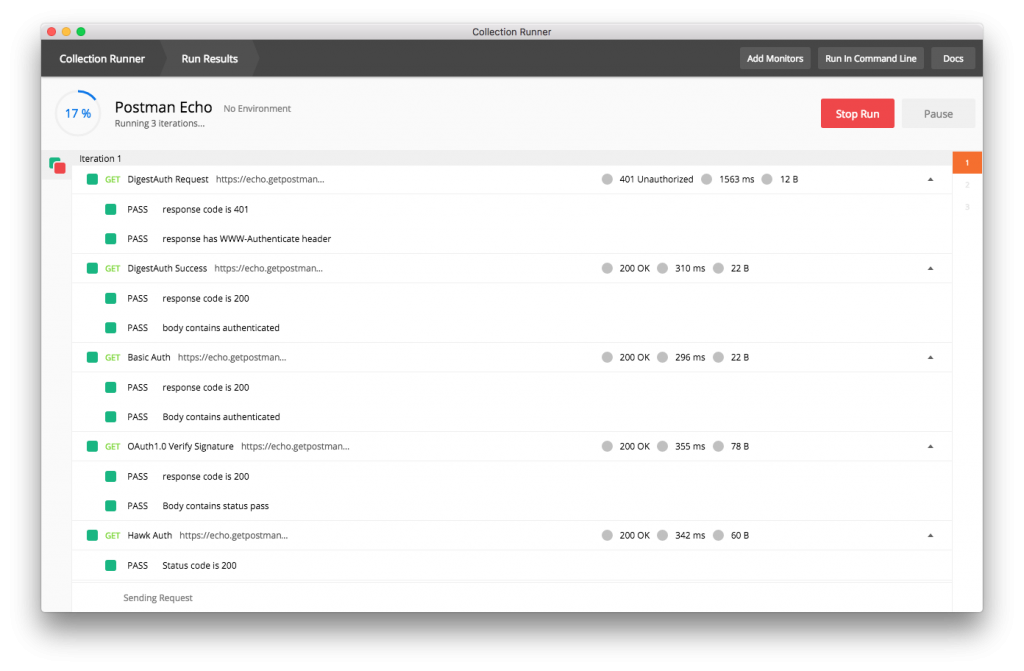
Once we select the collection we want to run along with other parameters and start a run, we should be taken to a completely new screen. This is the heart of the Runner, and is where you can look at all requests you’ve sent in detail. It is essentially a list of all requests sent, grouped by the iteration they were sent in.
Taking a quick glance at this list is a lot more informative than before. You can see how long a request took, how large the response was and what the response status was, much like the Postman app. Each list item here is a request in that was sent, the children of which are the tests that belong to the request. This makes debugging easy, as you can easily look at which tests failed and identify which request ran the failed test.
The list is also chronologically sorted, which means that all requests are logged in the order they were sent in. If you sent a request twice, it’ll be logged twice. This subtle change should be immensely helpful for people who make extensive use of setNextRequest.
Oh, but we’re not done yet. You can click on a request name to open up a little popup that has information about the request that was sent. This includes the Request URL, the Request Headers, the Response Headers, and the Response Body (provided it isn’t too large). This means instant feedback on what went wrong. No need to “console.log” to check your API response, since all the information you might need is right there, making debugging a pleasant experience.
When you have large collections, the response logging can take a toll on the memory usage. You can reduce the Runner’s memory footprint by choosing to log only specific responses. The dropdown in the Run parameter selector allows you to do this.
There’s even an iteration bar to the right, the numbers on which are bookmarks to iterations. This means you can concentrate on one iteration at a time, but other iterations are always easily reachable. To the left, you’ll notice filters. You can control what shows up in the list using these. Applying the failed filter will only show you requests where at least one test failed.
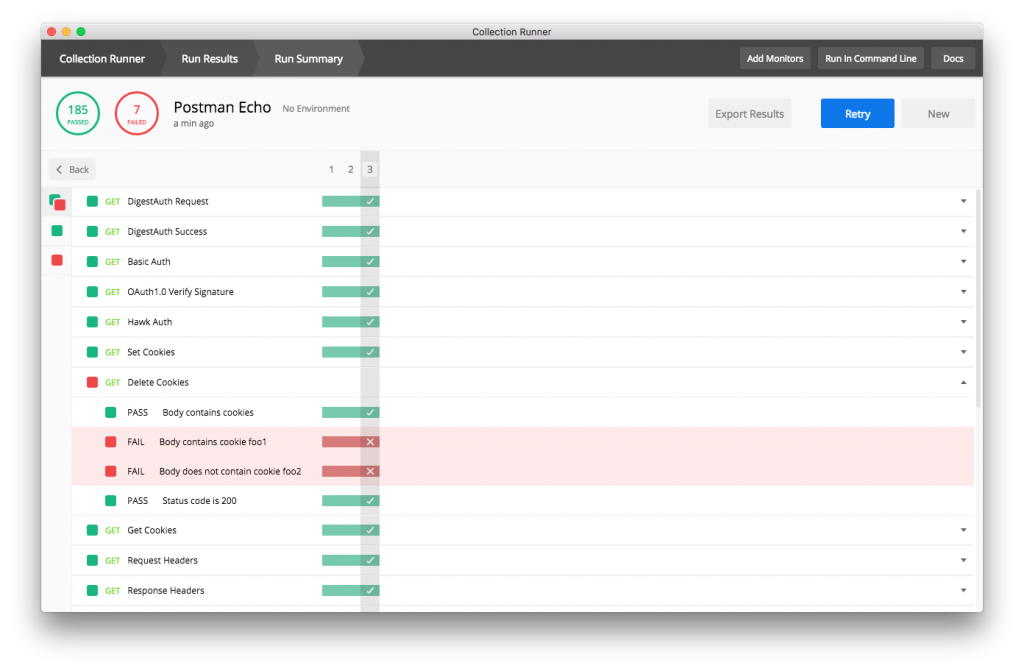
Once the run completes, a bright orange button should appear to the right side of the Run header in typical Postman fashion. This will take you to the Run Summary screen.
This is, as the name says, an overview of your run. The timelines are a neat way to show you the status of all requests in your collection spread over iterations so you can look how stable your API is. This is also a great view for glancing through large iteration sets. Each request here is collapsible, so opening a request up will show you the timeline of each test in the request.
Navigation between these three major sections of the Runner (the Selector, the Results and the Summary can be done using the top header.
Other new features include pausing runs, parallel runs and small fixes here and there, but I’ll leave it to you guys to explore! We hope you like the new runner as much as we loved building it!
As always, our support channels are always up if you need help, find a bug or have feedback. You can email us at [email protected], or, what I prefer, joining our Slack Community, where you can talk to the team and other developers directly.
The latest Canary builds are available for OSX (x64) / Windows (x86 or x64) / Linux (x86 or x64) / Chrome.


