You Can Now Capture Responses Using the Postman Proxy
The Postman proxy helps you debug your application by capturing HTTP traffic and creating a collection that can be shared with users, or to create documentation. To do so, it sits in the middle of the client and the server to intercept the traffic that can then be further analyzed in Postman.

My previous blog post explains how you can enable capturing traffic for HSTS-enabled websites. Now, the latest version of Postman supports capturing responses along with requests, all for better debugging and documentation generation.
Debug your application by analyzing requests and responses
With the latest release, Postman lets you capture the request and responses and save them to your workspace’s history or to a collection. This can help you debug the sequence in which the API calls are made and the exact data being exchanged. You don’t need to execute the request again in Postman to inspect the response. Follow the steps here to enable response capturing via the Postman proxy.
Manage requests better with intelligent grouping
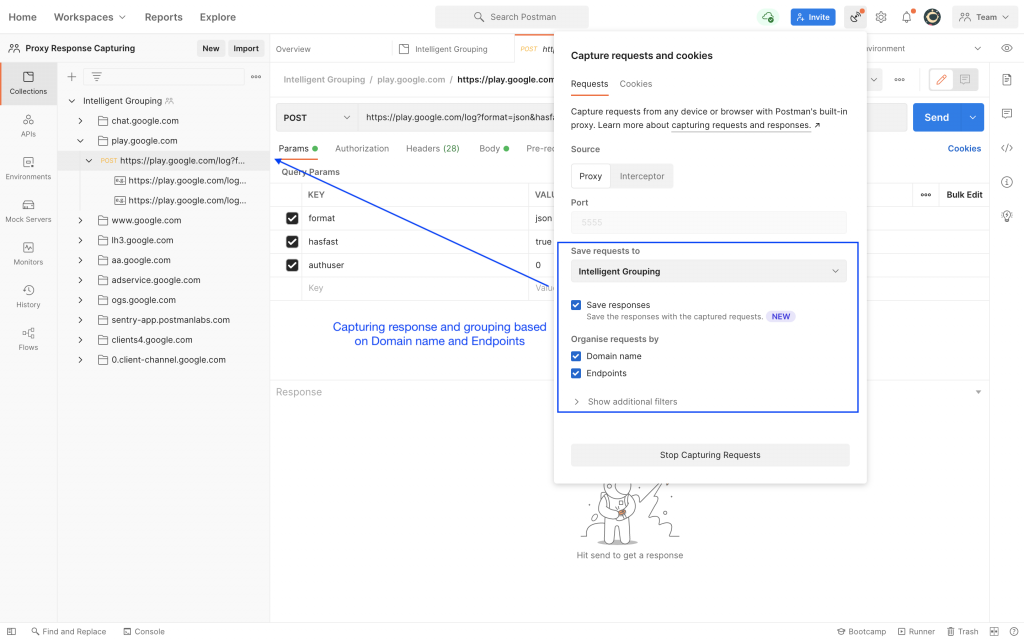
You can also group the requests and responses in collections based on the domain names and endpoints. Domain-based grouping creates a folder for every new domain that requests are captured for. Grouping by endpoints lets you create requests corresponding to various operations, with multiple requests to the same operation saved as examples. Both grouping options are only enabled if requests are being saved to a collection. Saving to history will always result in a flat list of requests.
You can also exclude calls to CSS/JS/image assets to retain the requests that are relevant to your API.

Grouping enables you to manage the collection better, which is then reflected in tests, documentation, and other elements that are based on the collection.
Capture responses to create comprehensive documentation
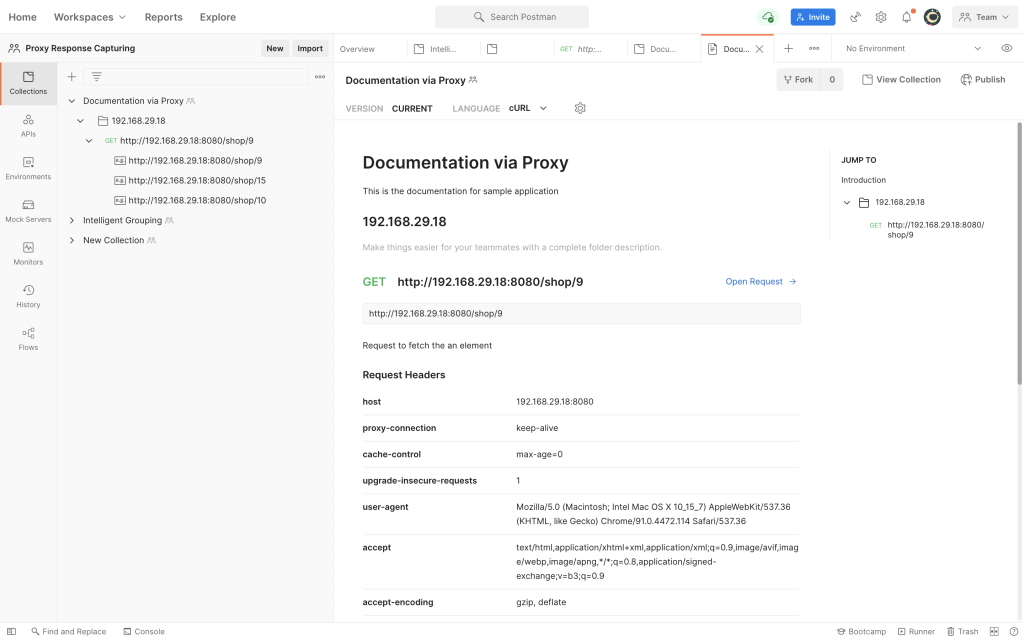
Postman documentation is a powerful feature that lets you document your API. The updated proxy simplifies this process by automatically capturing different responses for each endpoint or operation, eliminating the need to add responses manually.
For a sample application that you have, you can define all the success and the error states of the API. Now, while making calls to this application via the Postman proxy, you will see the requests and the corresponding responses being captured and arranged under folders and as examples in the collection. You can browse through the collection and add descriptions corresponding to the collection, folders, and requests via the context menu. You will now have documentation complete with each type of response that your API returns.


Is there any way I can download 8.9.1 version from postman.com. The current version 8.10 we are experiecing some issues
Hi, Please contact our support team at http://www.postman.com/support and they’ll be able to help you!
gracias a todos los que. integran el equipo.postman.com.,?
I think one of your ads triggered my browser to resize, you may well want to put that on your blacklist.