Audit your AWS infrastructure with Postman
With the advent of cloud infrastructure services, both singular users and organizations are migrating to newer, more streamlined platforms. With the convenience of platform management provided by various web service providers, resources like servers and databases can be provisioned with ever-growing ease.
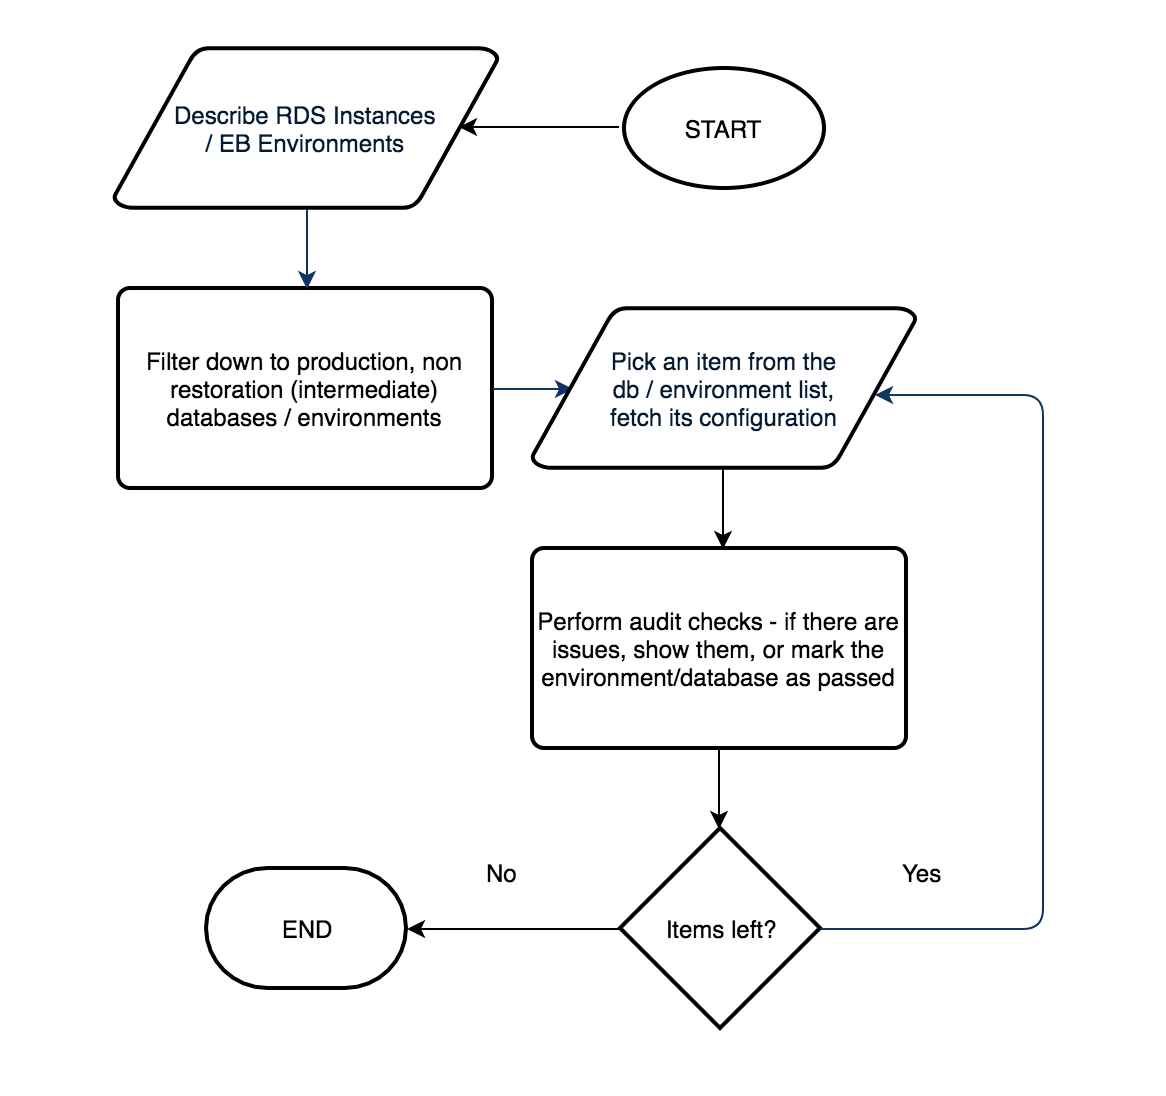
As you might have already guessed, this is a classic double-edged sword. An army of cloud resources that have not been accounted for is a recipe for disaster. Hence, there is a need to automate configuration auditing for databases and server environments, regardless of the underlying infrastructure provider. Among the manual routes to this end, spreadsheets are a good visual representation, but not the best option for frequent checks. Not to mention, such sheets are a pain to create and difficult to maintain.
The idea is to create a system that will run at fixed intervals to provide notifications on all fallacies within both spaces. This is where Postman Collections (a set of requests) and Monitors (to run the collection periodically) step in to offload all the heavy lifting. Two collections, one for Amazon Relational Database Service (Amazon RDS) instances and the other for AWS Elastic Beanstalk environments, can be used with monitors to run at desired intervals.
These collections iterate over environments or databases respectively, and require an Amazon Web Services (AWS) access id and a secret access key. These values must be present in the collection run environment. Additionally, these collections can be made to work with any valid AWS region via the awsRegion environment variable (defaults to us-east-1 if not set).
In this example, AWS authorization helpers in Postman have been used throughout the collection to make signed AWS API requests. The actual audit sequence is housed within test scripts where expected configuration values are enforced.
The final test results have been tweaked a little to make them easier to process. For environments or databases that pass the audit, a single successful test result is shown, similar to the one below.
For environments or databases that have issues with their configuration, only the incorrect configuration values show up as failed tests. Note that the values in brackets are the actual values of the configuration.
As far as additional scopes go, adding exceptions to these rules, as well as enforcing your own custom rules can also be done quite easily. With Postman monitors set up, receiving results directly within Slack, or any other medium supported by Postman integrations or using the Postman API is also possible.
Try it yourself
To use these collections for your AWS infrastructure:
- From the IAM console on your AWS dashboard, create two bot users (without console sign-in access): one for an Elastic Beanstalk audit, and the other for an RDS audit.
- Assign the custom policy below to the RDS audit bot user. For ElasticBeanstalk, use the inbuilt AWSElasticBeanstalkReadOnlyPolicy:
{ "Version": "2012-10-17", "Statement": [ { "Sid": "ReadRDSConfigAndMetrics", "Effect": "Allow", "Action": [ "rds:DescribeDBInstances", "rds:ListTagsForResource", "cloudwatch:GetMetricStatistics" ], "Resource": "*" } ] } - Create API keys for both bot users above. The Access Key ID and Secret Access Key will become the environment variables `id` and `key` respectively.
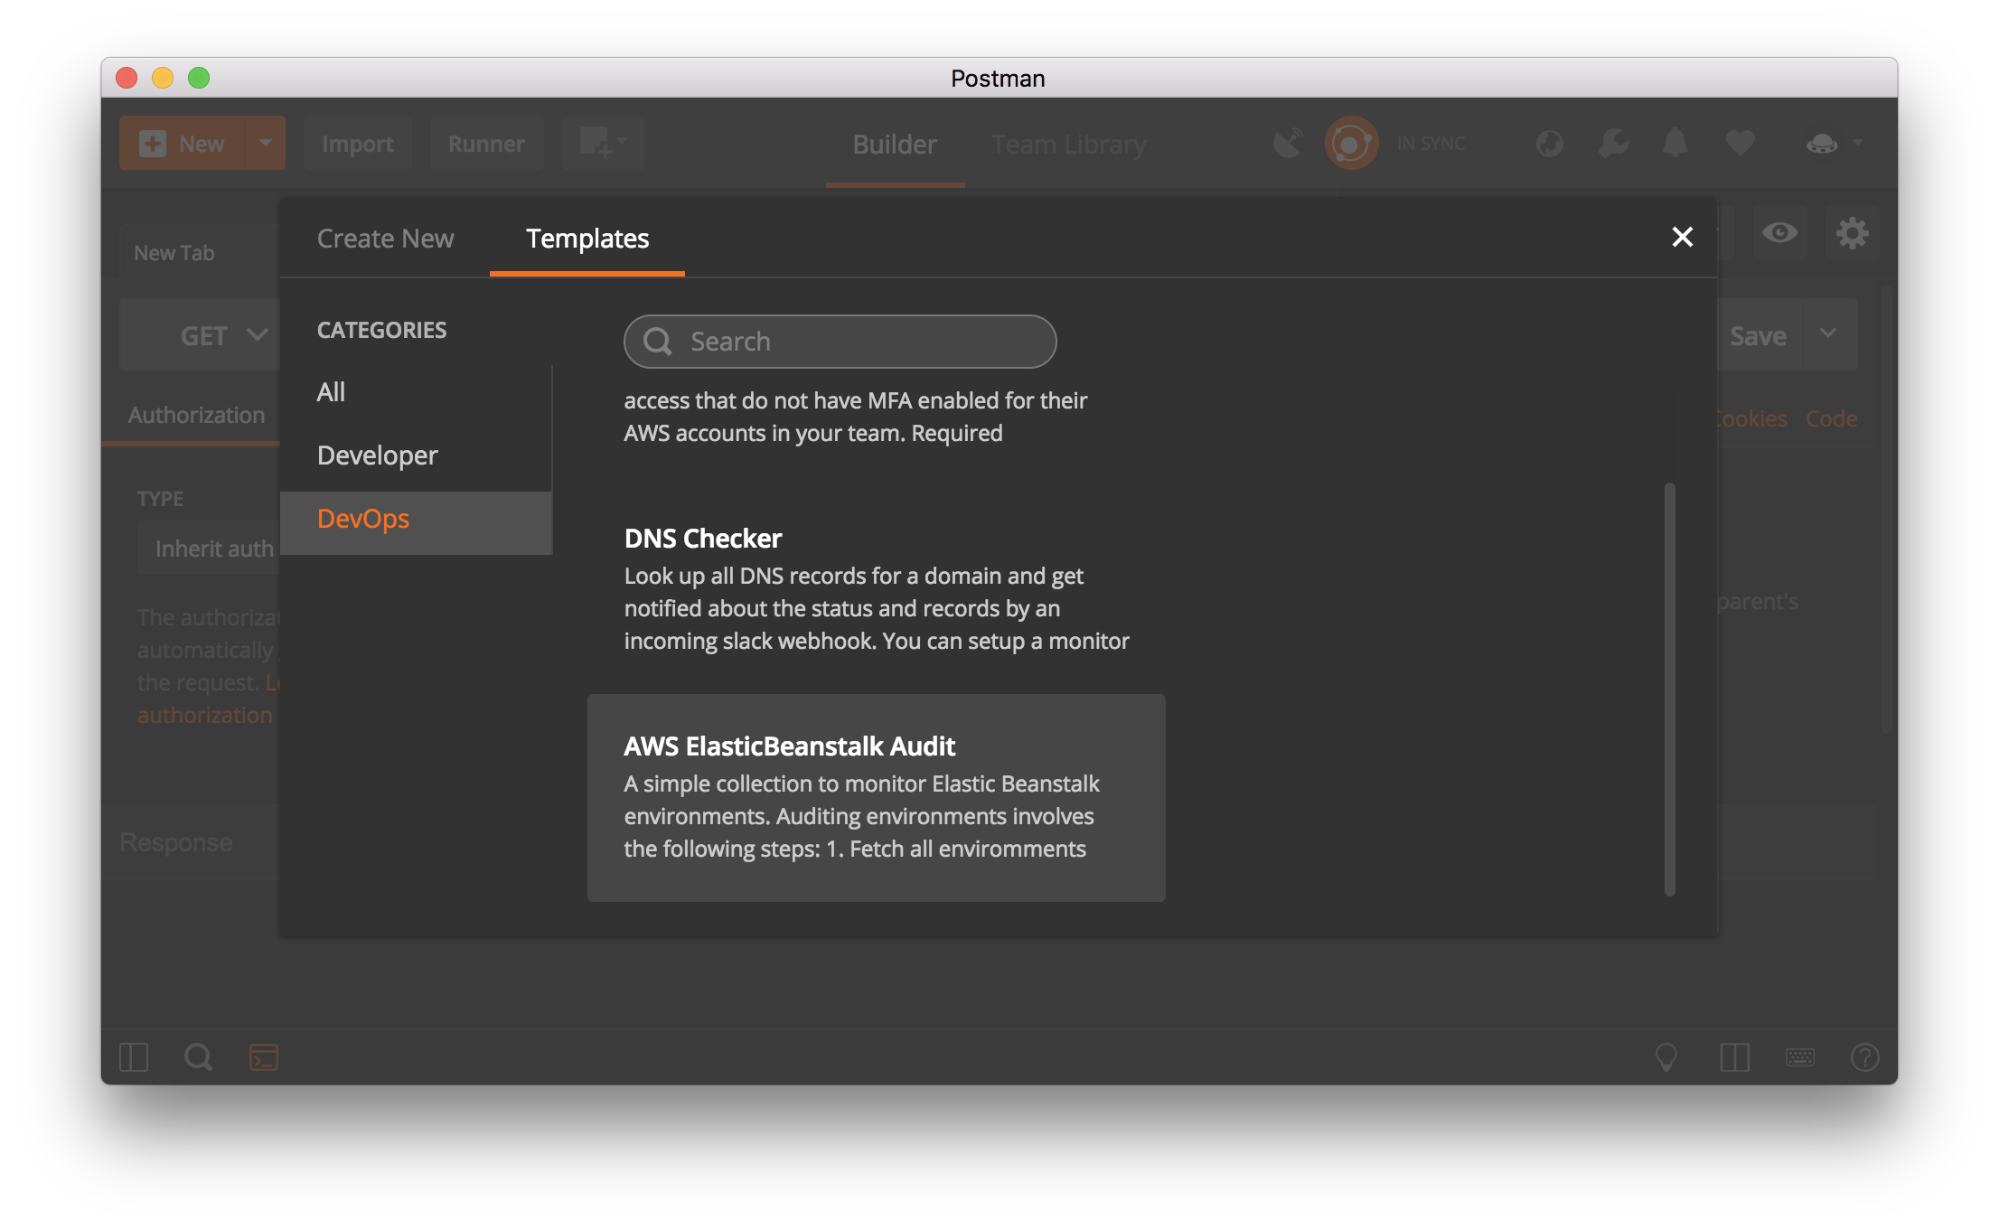
- We’ll be using Postman’s NEW button to streamline the collection and environment imports. In the Postman app, click on the orange New button in the top left corner of your Postman app. Under the Templates tab, select the DevOps category in the left sidebar. Select either the `AWS ElasticBeanstalk Audit` or `AWS RDS Audit` template, and confirm your selection by clicking the Use this template button.

- Adjust the “monitor run frequency” as desired. The recommended value is once every day. Confirm your configuration options and hit Create.
- Lastly, update the environment by copying the AWS API keys for RDS and ElasticBeanstalk bot users (created in steps 1-3) using the access key id for the environment variable `id`, and the secret access key for `key`.
And that’s it! You’ve just automated your AWS infrastructure audits with Postman monitors. Feel free to get back to us with your thoughts in the comments section.
* NOTE: These collections already take care of handling paginated responses from the AWS API, so they will work even if the total number of environments and databases exceeds the maximum batch size for RDS and ElasticBeanstalk API calls (100 each, at the time of writing).
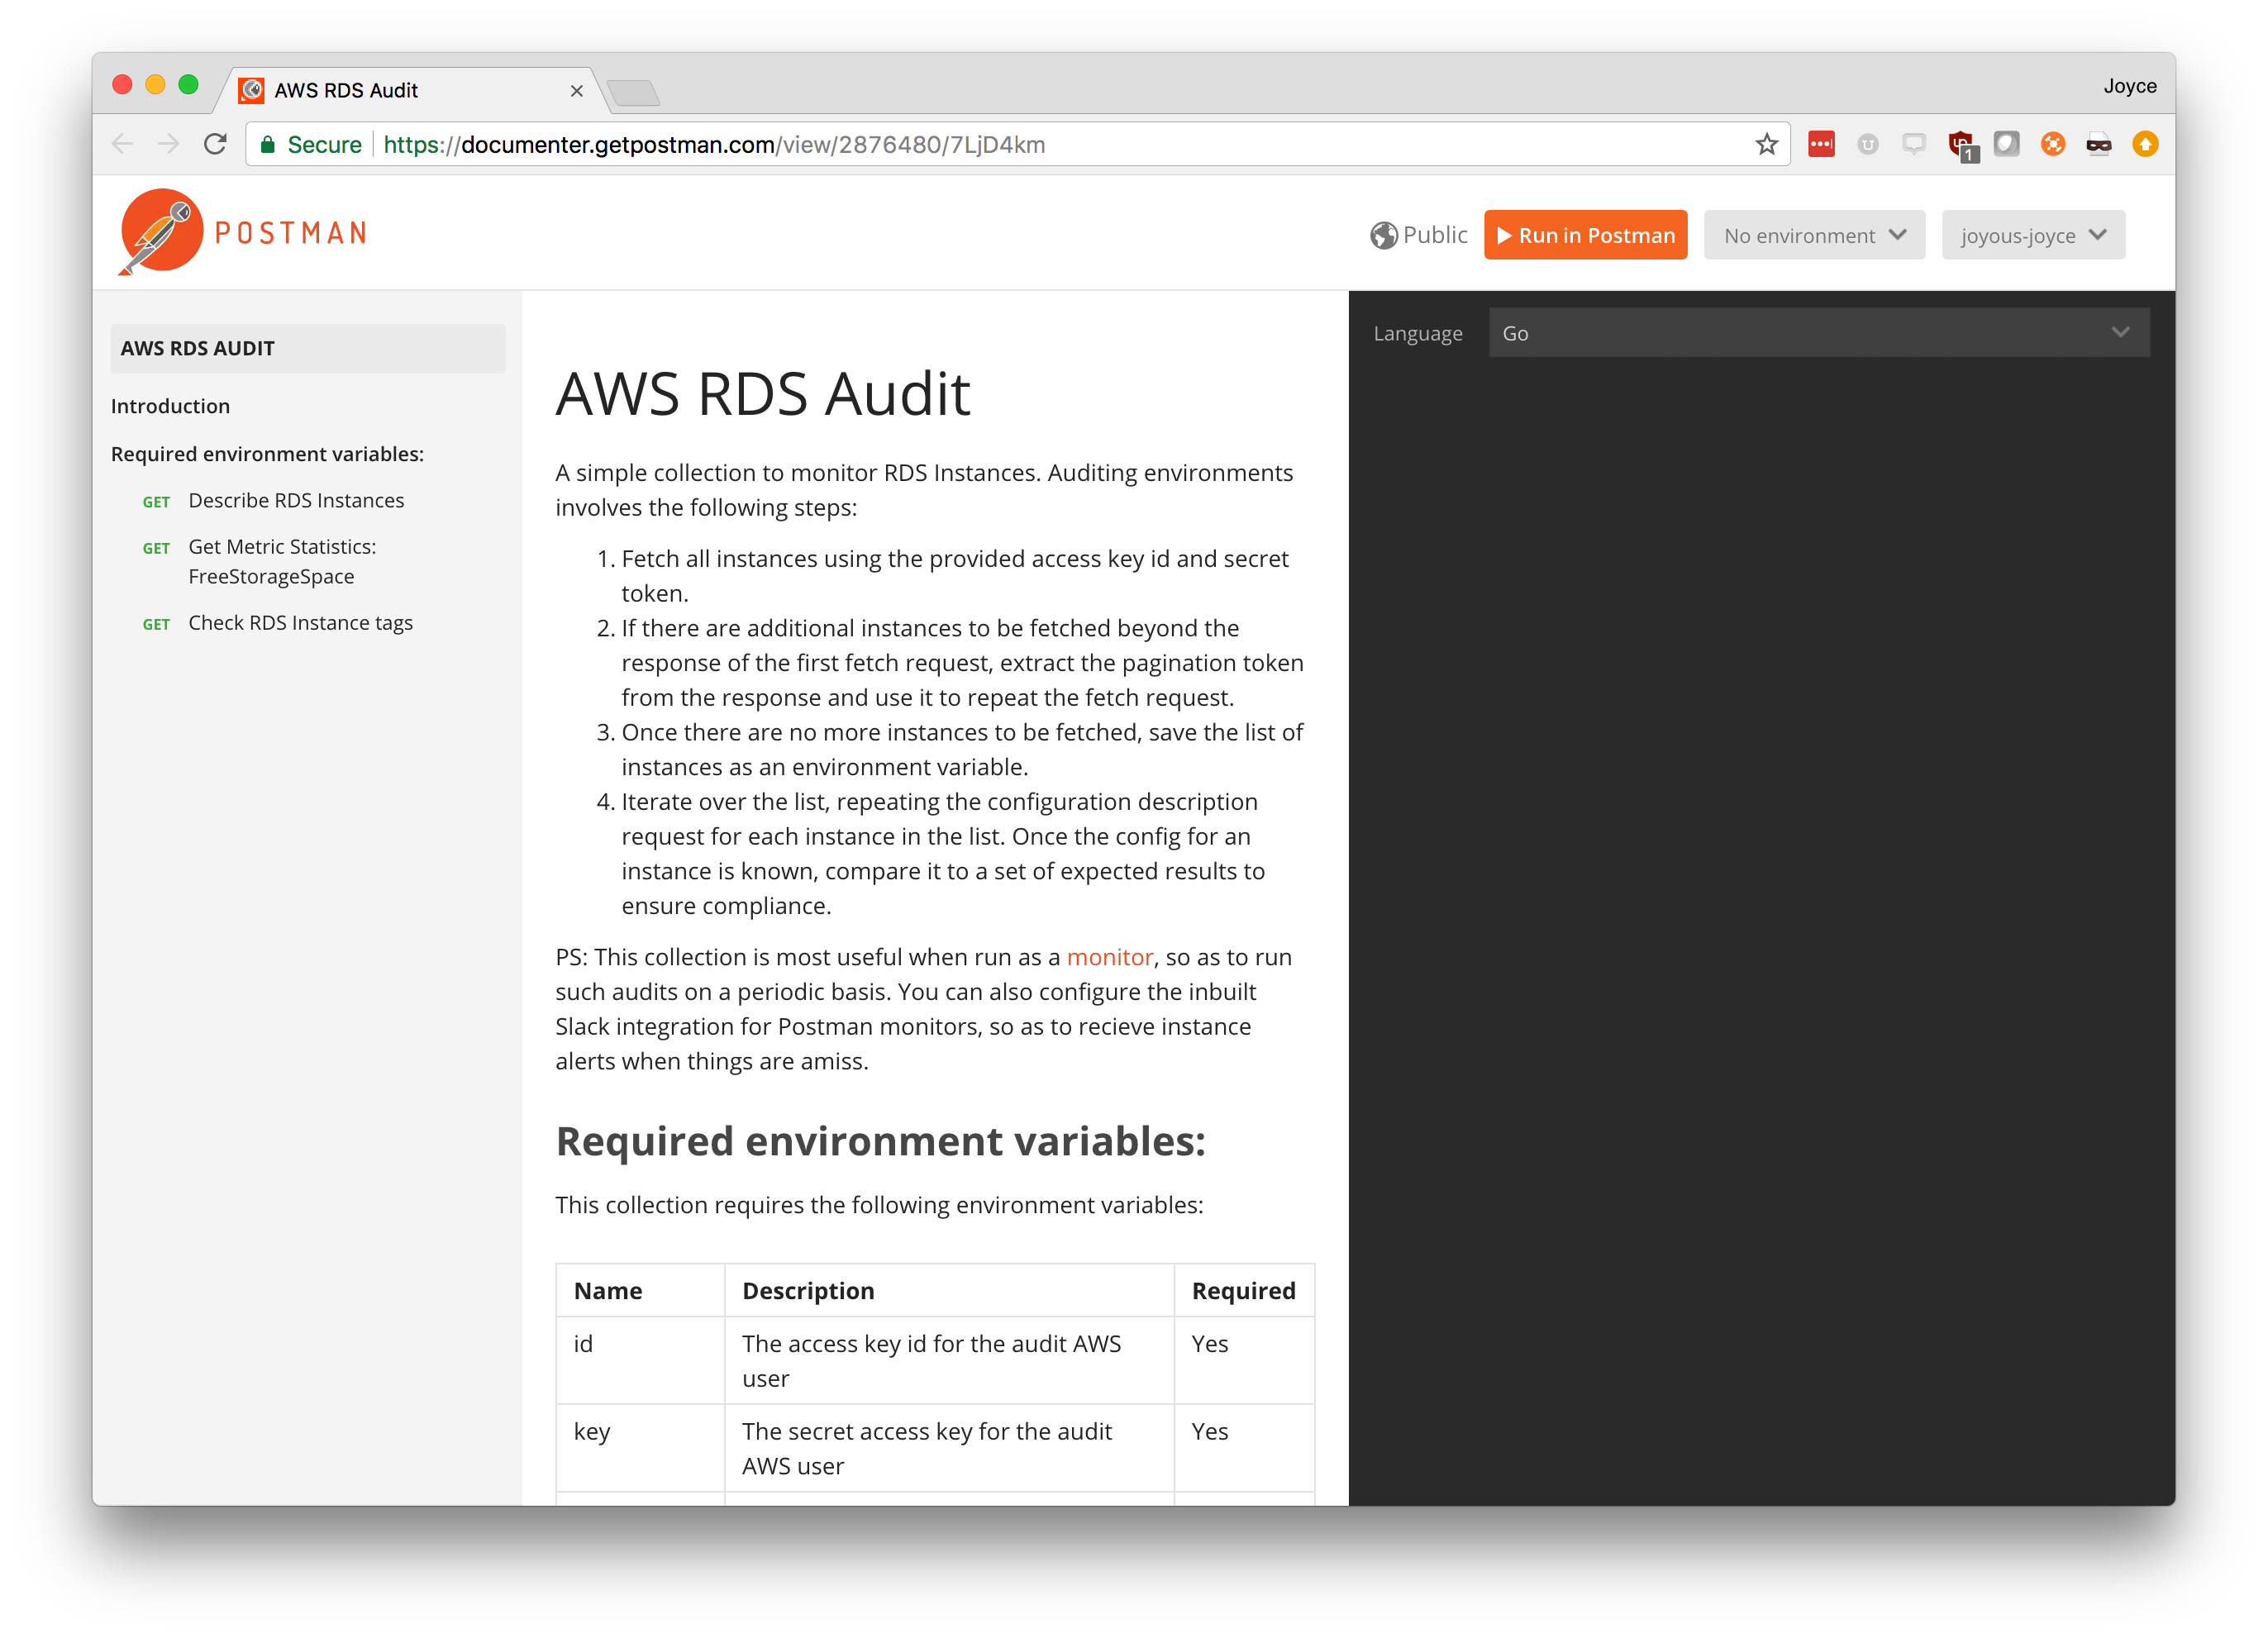
Need help getting started? Complete documentation for these collections can be found within the collections themselves, and at the links below:


yes, yes , yesss ! thanks Kunal